http://www.dissolutiontech.com/DTresour/800Articles/800_art1.html
IVIVR versus IVIVC
James E. Polli, Ph.D.
University of Maryland School of Pharmacy, Baltimore MD
I
t is natural to try to relate in vitro dissolution data to in vivo pharmacokinetic data. An effort to connect dissolution and pharmacokinetic results is often referred to as "in vitro-in vivo correlation" (IVIVC) analysis. Over the last 40 years, three often-used approaches to perform IVIVC are the so-called Level A, Level B, and Level C approaches (1). Among these three, Level A is generally viewed as the best method, since Level A utilizes all dissolution and pharmacokinetic data. Level B also utilizes all dissolution and pharmacokinetic data, but arguably is less insightful and helpful.
Level A IVIVC and its Failure for Immediate Release
For Level A analysis, the fraction drug absorbed (Fa) is plotted against the fraction drug dissolved (Fd). The fraction drug absorbed profile is obtained by deconvoluting the plasma profile. Deconvolution is essentially a back calculation to answer the question: "What must the drug absorption profile have been, given the plasma profile?" Of course, deconvolution requires some assumptions. The often sought out Level A profile is a one-to-one relationship between absorption and dissolution, with slope equal to one and y-intercept of zero. Figure 1 presents a practically ideal Level A result.
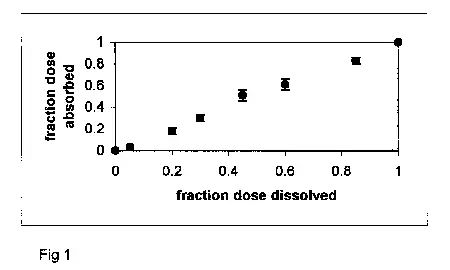
Figure 1. Fa versus Fd profile for diltiazem HCl ER capsules.
Release is rate-limiting, resulting in a linear profile
(i.e. Level A IVIVC).
So why has the relationship in Figure 1 been a Holy Grail over the last 30 years? The simple answer lies in the fact that alternative methods are more difficult, and were practically unavailable 30 years ago. Level A analysis requires linear regression of Fa against Fd. Linear regression was (and still can be) easily performed by hand. The first commercially available computers provided linear regression software. Hence, given its advantages over Level B and Level C, along with the computational availability to perform linear regression, Level A analysis had become the preferred method to relate in vitro dissolution to in vivo pharmacokinetics.
A statistic from Level A analysis is r, the correlation coefficient. Its square, r2, ranges from zero to one and is a measure of the strength of relationship between Fa against Fd. Often, results with sufficiently large r2 (e.g. greater than 0.9) yielded "a (successful) correlation." An r2 value that was too low resulted in a "no correlation" conclusion.
From this type of analysis, the term in vitro-in vivo correlation (IVIVC) evolved. Numerous IVIVC studies are in the literature. Controlled release products, rather than immediate release products, are the focuses in the IVIVC literature. Similarly, compendial and regulatory guidance (1,2) has been provided for controlled release products. IVIVC analysis for controlled release products is well accepted. Notable is that IVIVC analysis for immediate release products have been less successful (1). This disappointment with immediate release products has perhaps resulted in a generally low expectation for IVIVC success for immediate release products, including the questioning of the appropriateness of subjecting immediate release products to IVIVC.
A reason for this lack of success and acceptance may be the general failure of the Level A method to immediate release products. As noted above, Level A has traditionally been the most common IVIVC approach and requires a linear(ized) relationship between fraction drug absorbed and fraction drug dissolved.
However, this reason to reject IVIVC analysis for immediate release products is poorly founded. Since only products with dissolution rate-limited absorption (and with complete absorption) can be expected to exhibit a Level A plot with a slope of one and zero intercept (3), immediate release products will "fail" the Level A method, as generally is the case (1). Only products with significantly dissolution rate-limited absorption (and essentially complete absorption) will exhibit an IVIVC plot that fits the Level A description [e.g. Fig. 1] (3).
The intrinsic inability of immediate release products to conform to a Level A "straight line" appearance does not indicate that dissolution from such products fails as a surrogate for bioavailability. Also, the "failure" of immediate release products to exhibit dissolution rate-limited absorption should not infer that immediate release products are inappropriate candidates for other more relevant forms of IVIVC analysis (i.e. non-linear forms of IVIVC). Of course, the relevance of a dissolution test needs to be defendable in terms of the mechanism of drug release from the dosage form, including the role of physicochemical and physiologic factors (4).
The Slippery Slope of "Correlation"


