正文
What is cytoscape
Cytoscape is an open source
software platform for visualizing
molecular
interaction networks
and
biological pathways
and integrating these
networks with annotations, gene expression profiles and other state
data. Although Cytoscape was originally designed for biological
research, now it is a general platform for complex network analysis
and visualization. Cytoscape core distribution provides a basic set
of features for data integration, analysis, and visualization.
Additional features are available as Apps (formerly called Plugins).
Apps are available for network and molecular profiling analyses,
new layouts, additional file format support, scripting, and
connection with databases. They may be developed by anyone using
the Cytoscape open API based on Java鈩?technology and App
community development is encouraged. Most of the Apps are freely
available from Cytoscape App Store.
How to install cytoscape
Simple cytoscape usage
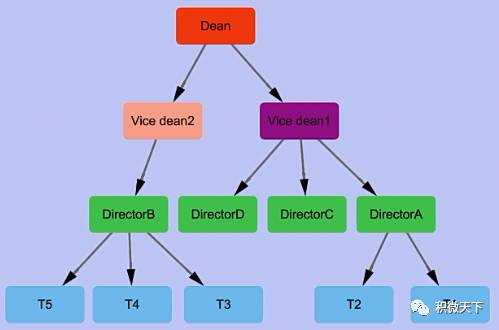
A toy data (saved in
toy.txt
)
SUPERIOR    SUBORDINATE
Dean    Vice dean1
Dean    Vice dean2
Vice dean1    DirectorA
Vice dean2    DirectorB
Vice dean1    DirectorC
Vice dean1    DirectorD
DirectorA    T1
DirectorA    T2
DirectorB    T3
DirectorB    T4
DirectorB    T5
The toy network

The video tutorial to show how to use
cytoscape
to transfer the text
into a network.
More cytoscape operations
Node searching, adding, deletion, selection and attribute chaning
-
Files needed
-
The video tutorial
-
Heatmap nodes color using expression data
-
Files needed
-
Effect picture
Cytoscape mapping gene expression to KEGG pathway

-
Files needed
-
Plugins needed
-
The video tutorial
-
Import a table to construct network
-
Import
-
Network
-
File
-
Selet a two-column file
, then a network is constructed.
-
Tools
-
NetworkAnalyzer
-
Network Analysis
-
Analyze network
, the attribute of the network is analyzed. The analyzing result can be used to set the visualization styles of nodes and edges.
Layout
    Attribute Circle
Layout
is my favorite algorithm to show networks especially when you select some nodes.
This algorithm can put nodes with same values together when you are
performing
Attribute Circle Layout
by the related
attributes
.
For example, I have two classes of genes, one is upregulated, the other is downregulated.
This information is saved in a two columns file with the first column containing gene names and
the second column named
expr
containing
0
(down-regulated) and
1
(up-regulated).
This file can be imported into Cytoscape by
File
-
Import
-
Table
.
Following one can select all these genes and perform
Attribute Circle
Layout
by
expr
.


