R语言多组箱线图
a
par(mfrow=c(3,2), mar=c(2,2,2,2)); 分区画图,mfrow:3行2列,mar每组图的边界设置。
for(i in 1:6){
boxplot(a[(i*2):(i*2+1)],range=1.5,width=NULL,varwidth=FALSE,notch=
FALSE,outline=TRUE,names(a[(i*2):(i*2+1)]),plot=TRUE,col=c("green","orange"),log="",horizontal=FALSE,add=FALSE,at=NULL);}
R语言相关系数图
a 相关系数值,有标题行和列
b相关系数P值,有标题行和列
pmat=apply(b,2,as.numeric);
d=apply(a,2,as.numeric);
rownames(d)
library(corrplot);
corrplot(d,method="ellipse",mar=c(0,0,0,0),tl.col="black",addCoef.col="black",tl.srt=0,tl.cex=1,cl.pos="n",
p.mat=pmat,sig.level=0.05,insig=c("blank"),number.cex=1,number.font=4);
R语言韦恩图
##加载VennDiagram软件包
> library (VennDiagram)
例1:
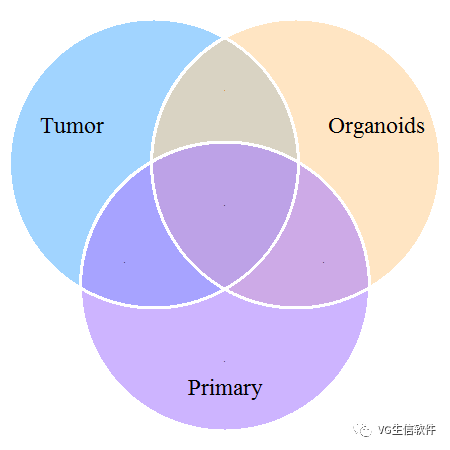
##生成三个不同的组合
> A
> B
> C
##使用venn.diagram功能绘图
>
venn.diagram(x=list(Tumor=A, Organoids=B, Primary=C), "My1.png", height
= 450, width = 450, resolution =300, imagetype="png", col="white",
fill=c(colors()[616], colors()[38], colors()[468]), alpha=c(0.6, 0.6,
0.6), lwd=c(1, 1, 1), cex=0, cat.dist=c(-0.07, -0.07, -0.05),
cat.pos=c(300, 60, 180), cat.cex=0.45)

例2:
##生成三个不同的组合
> D
> E
> F
##使用venn.diagram功能绘图
> venn.diagram(x=list(Tumor=D,
Organoids=F,Primary=E), "My2.png", height = 450, width = 450,
resolution =300, imagetype="png", col="gray",fill=c(colors()[148],
colors()[589], colors()[116]), alpha=c(0.6, 0.6, 0.6), lwd=0.5, cex=0,
cat.dist=c(-0.07, -0.07, -0.05), cat.pos=c(100, 260, 0),cat.cex=0.45,
cat.col="black", rotation.degree=180)

例3:
##生成四个不同的组合
> A
> B
> C
> D
##使用venn.diagram功能绘图
> venn.diagram(x=
list(A = A,D = D,B = B,C = C), filename = "My3.png", height = 450,
width = 450,resolution =300, imagetype="png", col ="transparent", fill
=c("cornflowerblue","green","yellow","darkorchid1"),alpha = 0.5,
label.col = c("orange", "white","darkorchid4", "white", "white",
"white", "white", "white","darkblue", "white", "white",
"white","white", "darkgreen", "white"), cex = 0.45,fontfamily = "serif",
fontface = "bold",cat.col =c("darkblue", "darkgreen",
"orange","darkorchid4"), cat.cex = 0.45,cat.pos = 0, cat.dist =
0.07,cat.fontfamily = "serif", rotation.degree = 270)

例4:
##生成四个不同的组合
> A
> B
> C
> D
##使用venn.diagram功能绘图
> venn.diagram(x=
list(A = A,D = D,B = B,C = C), filename = "My4.png", height = 450,
width = 450,resolution =300, imagetype="png",
col="transparent",fill=c("cornflowerblue","green","yellow","darkorchid1"),alpha
= 0.50, cex=0.45, cat.cex=0.45)

> venn.diagram(x
=list(A = A,D = D,B = B,C = C), filename = "My5.png", height = 450,
width= 450, resolution =300, imagetype="png", lwd=0.6, fill
=c("cornflowerblue","green","yellow","darkorchid1"),cex=0.45,
cat.cex=0.45)


