
大数据文摘作品,转载具体要求见文末
编译团队:Aileen,徐凌霄
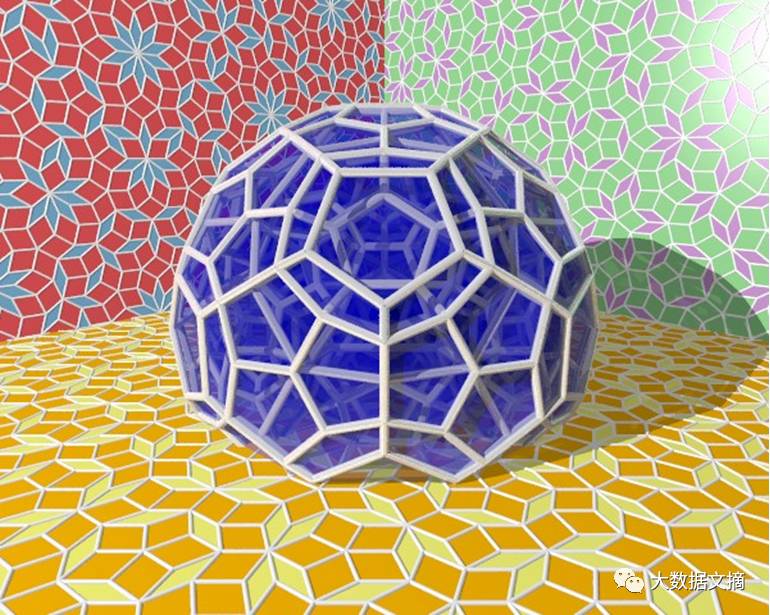
用Python绘制著名的数学图片或动画,展示数学中的算法魅力。
本项⽬目将持续更更新,数学中有着太多有趣的事物可以⽤用代码去展示。 欢迎提出建议和参与建设!
后台回复
“数学”
查看完整代码集哦

代码:46 lines (34 sloc)
1.01 KB
|
'''
|
|
A fast Mandelbrot set wallpaper renderer
|
|
|
|
reddit discussion: https://www.reddit.com/r/math/comments/2abwyt/smooth_colour_mandelbrot/
|
|
'''
|
|
import
numpy
as
np
|
|
from
PIL
import
Image
|
|
from
numba
import
jit
|
|
|
|
|
|
MAXITERS
=
200
|
|
RADIUS
=
100
|
|
|
|
|
|
@jit
|
|
def
color
(
z
,
i
):
|
|
v
=
np.log2(i
+
1
-
np.log2(np.log2(
abs
(z))))
/
5
|
|
if
v
<
1.0
:
|
|
return
v
**
4
, v
**
2.5
, v
|
|
else
:
|
|
v
=
max
(
0
,
2
-
v)
|
|
return
v, v
**
1.5
, v
**
3
|
|
|
|
|
|
@jit
|
|
def
iterate
(
c
):
|
|
z
=
0
j
|
|
for
i
in
range
(
MAXITERS
):
|
|
if
z.real
*
z.real
+
z.imag
*
z.imag
>
RADIUS
:
|
|
return
color(z, i)
|
|
z
=
z
*
z
+
c
|
|
return
0
,
0
,
0
|
|
|
|
|
|
def
main
(
xmin
,
xmax
,
ymin
,
ymax
,
width
,
height
):
|
|
x
=
np.linspace(xmin, xmax, width)
|
|
y
=
np.linspace(ymax, ymin, height)
|
|
z
=
x[
None
, :]
+
y[:,
None
]
*
1
j
|
|
red, green, blue
=
np.asarray(np.frompyfunc(iterate,
1
,
3
)(z)).astype(np.float)
|
|
img
=
np.dstack((red, green, blue))
|
|
Image.fromarray(np.uint8(img
*
255
)).save(
'
mandelbrot.png
'
)
|
|
|
|
|
|
if
__name__
==
'
__main__
'
:
|
|
main(
-
2.1
,
0.8
,
-
1.16
,
1.16
,
1200
,
960
)
|
代码链接:https://github.com/neozhaoliang/pywonderland/tree/master/src/domino

代码:53 lines (40 sloc)
1.24 KB
|
'''
|
|
A kaleidoscope pattern with icosahedral symmetry.
|
|
'''
|
|
import
numpy
as
np
|
|
from
PIL
import
Image
|
|
from
matplotlib.colors
import
hsv_to_rgb
|
|
|
|
|
|
def
Klein
(
z
):
|
|
'''
Klein's j-function
'''
|
|
return
1728
*
(z
*
(z
**
10
+
11
*
z
**
5
-
1
))
**
5
/
\
|
|
(
-
(z
**
20
+
1
)
+
228
*
(z
**
15
-
z
**
5
)
-
494
*
z
**
10
)
**
3
|
|
|
|
|
|
def
RiemannSphere
(
z
):
|
|
'''
|
|
map the complex plane to Riemann's sphere via stereographic projection
|
|
'''
|
|
t
=
1
+
z.real
*
z.real
+
z.imag
*
z.imag
|
|
return
2
*
z.real
/
t,
2
*
z.imag
/
t,
2
/
t
-
1
|
|
|
|
|
|
def
Mobius
(
z
):
|
|
'''
|
|
distort the result image by a mobius transformation
|
|
'''
|
|
return
(z
-
20
)
/
(
3
*
z
+
1
j
)
|
|
|
|
|
|
def
main
(
imgsize
):
|
|
x
=
np.linspace(
-
6
,
6
, imgsize)
|
|
y
=
np.linspace(
6
,
-
6
, imgsize)
|
|
z
=
x[
None
, :]
+
y[:,
None
]
*
1
j
|
|
z
=
RiemannSphere(Klein(Mobius(Klein(z))))
|
|
|
|
#
define colors in hsv space
|
|
H
=
np.sin(z[
0
]
*
np.pi)
**
2
|
|
S
=
np.cos(z[
1
]
*
np.pi)
**
2
|
|
V
=
abs
(np.sin(z[
2
]
*
np.pi)
*
np.cos(z[
2
]
*
np.pi))
**
0.2
|
|
HSV
=
np.dstack((H, S, V))
|
|
|
|
#
transform to rgb space
|
|
img
=
hsv_to_rgb(
HSV
)
|
|
Image.fromarray(np.uint8(img
*
255
)).save(
'
kaleidoscope.png
'
)
|
|
|
|
|
|
if
__name__
==
'
__main__
'
:
|
|
import
time
|
|
start
=
time.time()
|
|
main(
imgsize
=
800
)
|
|
end
=
time.time()
|
|
print
(
'
runtime:
{
:3f
}
seconds
'
.format(end
-
start))
|

代码:46 lines (35 sloc)
1.05 KB
|
import
numpy
as
np
|
|
import
matplotlib.pyplot
as
plt
|
|
from
numba
import
jit
|
|
|
|
|
|
#
define functions manually, do not use numpy's poly1d funciton!
|
|
@jit
(
'
complex64(complex64)
'
,
nopython
=
True
)
|
|
def
f
(
z
):
|
|
#
z*z*z is faster than z**3
|
|
return
z
*
z
*
z
-
1
|
|
|
|
|
|
@jit
(
'
complex64(complex64)
'
,
nopython
=
True
)
|
|
def
df
(
z
):
|
|
return
3
*
z
*
z
|
|
|
|
|
|
@jit
(
'
float64(complex64)
'
,
nopython
=
True
)
|
|
def
iterate
(
z
):
|
|
num
=
0
|
|
while
abs
(f(z))
>
1e-4
:
|
|
w
=
z
-
f(z)
/
df(z)
|
|
num
+=
np.exp(
-
1
/
abs
(w
-
z))
|
|
z
=
w
|
|
return
num
|
|
|
|
|
|
def
render
(
imgsize
):
|
|
x
=
np.linspace(
-
1
,
1
, imgsize)
|
|
y
=
np.linspace(
1
,
-
1
, imgsize)
|
|
z
=
x[
None
, :]
+
y[:,
None
]
*
1
j
|
|
img
=
np.frompyfunc(iterate,
1
,
1
)(z).astype(np.float)
|
|
fig
=
plt.figure(
figsize
=
(imgsize
/
100.0
, imgsize
/
100.0
),
dpi
=
100
)
|
|
ax
=
fig.add_axes([
0
,
0
,
1
,
1
],
aspect
=
1
)
|
|
ax.axis(
'
off
'
)
|
|
ax.imshow(img,
cmap
=
'
hot
'
)
|
|
fig.savefig(
'
newton.png
'
)
|
|
|
|
|
|
if
__name__
==
'
__main__
'
:
|
|
import
time
|
|
start
=
time.time()
|
|
render(
imgsize
=
400
)
|
|
end
=
time.time()
|
|
print
(
'
runtime:
{
:03f
}
seconds
'
.format(end
-
start))
|
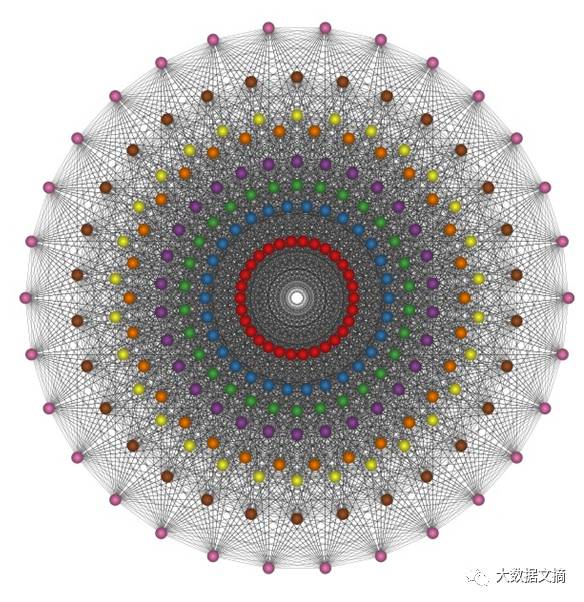
代码链接:https://github.com/neozhaoliang/pywonderland/blob/master/src/misc/e8.py
代码链接:
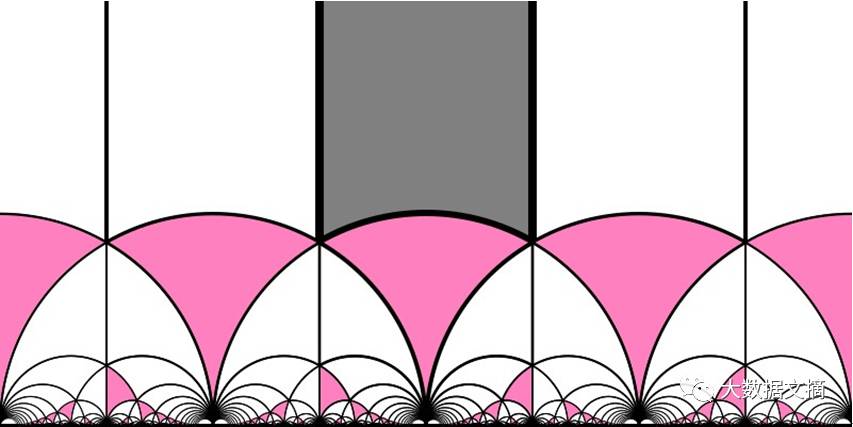
https://github.com/neozhaoliang/pywonderland/blob/master/src/misc/modulargroup.py

代码链接:
https://github.com/neozhaoliang/pywonderland/blob/master/src/misc/penrose.py
代码链接:https://github.com/neozhaoliang/pywonderland/tree/master/src/wilson
代码链接:
https://github.com/neozhaoliang/pywonderland/tree/master/src/grayscott
代码:69 lines (48 sloc) 2.18 KB
|
#
pylint: disable=unused-import
|
|
#
pylint: disable=undefined-variable
|
|
|
|
from
itertools
import
combinations, product
|
|
import
numpy
as
np
|
|
from
vapory
import
*
|
|
|
|
|
|
class
Penrose
(
object
):
|
|
|
|
GRIDS
=
[np.exp(
2
j
*
np.pi
*
i
/
5
)
for
i
in
range
(
5
)]
|
|
|
|
def
__init__
(
self
,
num_lines
,
shift
,
thin_color
,
fat_color
,
**
config
):
|
|
self
.num_lines
=
num_lines
|
|
self
.shift
=
shift
|
|
self
.thin_color
=
thin_color
|
|
self
.fat_color
=
fat_color
|
|
self
.objs
=
self
.compute_pov_objs(
**
config)
|
|
|
|
|
|
def
compute_pov_objs
(
self
,
**
config
):
|
|
objects_pool
=
[]
|
|
|
|
for
rhombi, color
in
self
.tile():
|
|
p1, p2, p3, p4
=
rhombi
|
|
polygon
=
|


