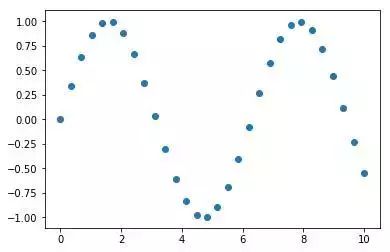

散点图是Matplotlib常用图形之一,与线形图类似。但是这种图形不再由线段连接,而是由独立的点、圆圈或其他形状构成。那么怎么画散点图呢?Matplotlib给出了两种不同的方法,去画散点图。如何在不同的情况下,合理的使用这两种方法?
"-webkit-tap-highlight-color: transparent; box-sizing: border-box; font-family: Consolas, Menlo, Courier, monospace; font-size: 16px; white-space: pre-wrap; position: relative; line-height: 1.5; color: rgb(153, 153, 153); margin: 1em 0px; padding: 12px 10px; background: rgb(244, 245, 246); border: 1px solid rgb(232, 232, 232); font-style: normal; font-variant-ligatures: normal; font-variant-caps: normal; font-weight: normal; letter-spacing: normal; orphans: 2; text-align: start; text-indent: 0px; text-transform: none; widows: 2; word-spacing: 0px; -webkit-text-stroke-width: 0px; text-decoration-style: initial; text-decoration-color: initial;">import numpy as np
import matplotlib.pyplot as plt
x= np.linspace(0, 10, 30)
y= np.sin(x)
plt.plot(x, y, 'o', color='black');
pre>
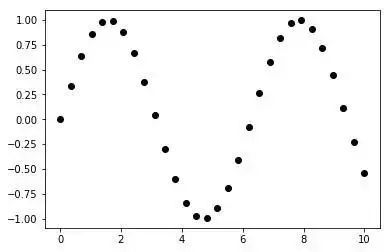
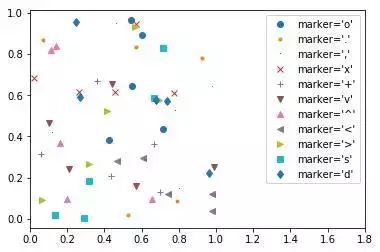
plt.plot()函数的第三个参数是一个字符,表示图形符号的类型。与你之前用 '-' 和 '--' 设置线条属性类似,对应的图形标记也有缩写形式。
"-webkit-tap-highlight-color: transparent; box-sizing: border-box; font-family: Consolas, Menlo, Courier, monospace; font-size: 16px; white-space: pre-wrap; position: relative; line-height: 1.5; color: rgb(153, 153, 153); margin: 1em 0px; padding: 12px 10px; background: rgb(244, 245, 246); border: 1px solid rgb(232, 232, 232); font-style: normal; font-variant-ligatures: normal; font-variant-caps: normal; font-weight: normal; letter-spacing: normal; orphans: 2; text-align: start; text-indent: 0px; text-transform: none; widows: 2; word-spacing: 0px; -webkit-text-stroke-width: 0px; text-decoration-style: initial; text-decoration-color: initial;">rng= np.random.RandomState(0)
formarkerin['o', '.', ',', 'x', '+', 'v', '^', ', '>', 's', 'd']:
plt.plot(rng.rand(5), rng.rand(5), marker,
label="marker='{0}'".format(marker))
plt.legend(numpoints=1)
plt.xlim(0, 1.8);
"-webkit-tap-highlight-color: transparent; box-sizing: border-box; font-family: Consolas, Menlo, Courier, monospace; font-size: 16px; white-space: pre-wrap; position: relative; line-height: 1.5; color: rgb(153, 153, 153); margin: 1em 0px; padding: 12px 10px; background: rgb(244, 245, 246); border: 1px solid rgb(232, 232, 232); font-style: normal; font-variant-ligatures: normal; font-variant-caps: normal; font-weight: normal; letter-spacing: normal; orphans: 2; text-align: start; text-indent: 0px; text-transform: none; widows: 2; word-spacing: 0px; -webkit-text-stroke-width: 0px; text-decoration-style: initial; text-decoration-color: initial;">plt.plot(x, y, '-ok')
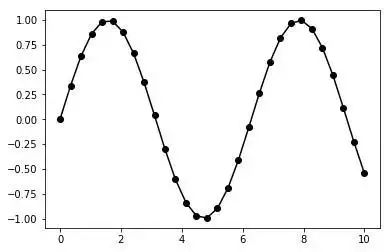
用图形标记的缩写形式,跟线段组合成一给新的字符,传给plt.plot()函数
"-webkit-tap-highlight-color: transparent; box-sizing: border-box; font-family: Consolas, Menlo, Courier, monospace; font-size: 16px; white-space: pre-wrap; position: relative; line-height: 1.5; color: rgb(153, 153, 153); margin: 1em 0px; padding: 12px 10px; background: rgb(244, 245, 246); border: 1px solid rgb(232, 232, 232); font-style: normal; font-variant-ligatures: normal; font-variant-caps: normal; font-weight: normal; letter-spacing: normal; orphans: 2; text-align: start; text-indent: 0px; text-transform: none; widows: 2; word-spacing: 0px; -webkit-text-stroke-width: 0px; text-decoration-style: initial; text-decoration-color: initial;">plt.plot(x, y, '-p', color='gray',
markersize=15, linewidth=4,
markerfacecolor='white',
markeredgecolor='gray',
markeredgewidth=2)
plt.ylim(-1.2, 1.2)
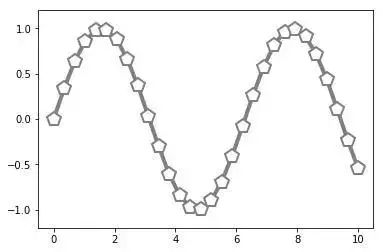
plt.plot函数非常灵活,可以满足各种不同的可视化配置需求。
这是另一个创建散点图的函数是plt.scatter。它的功能非常强大,其用法与plt.plot函数类似。
<pre style="-webkit-tap-highlight-color: transparent; box-sizing: border-box; font-family: Consolas, Menlo, Courier, monospace; font-size: 16px; white-space: pre-wrap; position: relative; line-height: 1.5; color: rgb(153, 153, 153); margin: 1em 0px; padding: 12px 10px; background: rgb(244, 245, 246); border: 1px solid rgb(232, 232, 232); font-style: normal; font-variant-ligatures: normal; font-variant-caps: normal; font-weight: normal; letter-spacing: normal; orphans: 2; text-align: start; text-indent: 0px; text-transform: none; widows: 2; word-spacing: 0px; -webkit-text-stroke-width: 0px; text-decoration-style: initial; text-decoration-color: initial;">plt.scatter(x, y, marker='o')
pre>