
概要
越来越普遍的融资交易是市场波动的重要来源之一:
最近市场大幅震荡。这种盘面侧面证明了融资交易在这轮行情里的重要性。这种史诗级的波动性让人回想起2015年市场泡沫时的场景。否则,我们如何才能解释,受类似的基本面因素驱动,但香港和内地市场年初至今表现的迥异?我们仔细分析了几类主体的交易行为,包括长期战略投资者,融资交易者,陆港通和投资中国的指数基金。除了作为股票天然多头的战略投资者始终如一地减持股票之外,其它主体都在买入 - 这毫不为奇。现在更重要的问题是,不同主体的这些交易对于市场前景的启示。
监管机构对融资交易的容忍度暂不明确;融资交易的占比作为观察监管容忍度的指标:
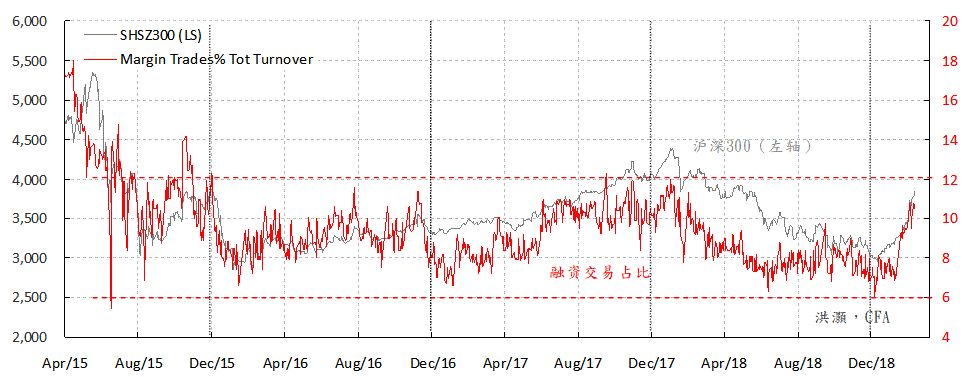
融资交易活动的变化与市场飙升的关系最为密切。如近年来的经验所示,融资交易在总成交里的占比能否突破其近几年来12%的上限,可以作为观察监管机构对融资交易容忍度的量化指标。现在,这个指标已经接近11%。据相关报道,广东正在研究场外配资交易,并建议券商不要与做场外配资的公司合作。另据报道,股指期货交易或在年底前正常化。这些表面上相悖的信号表明监管机构对融资交易的态度目前似乎尚未明确。
海外杠杆资金利息成本较低,正通过陆股通进入中国市场:
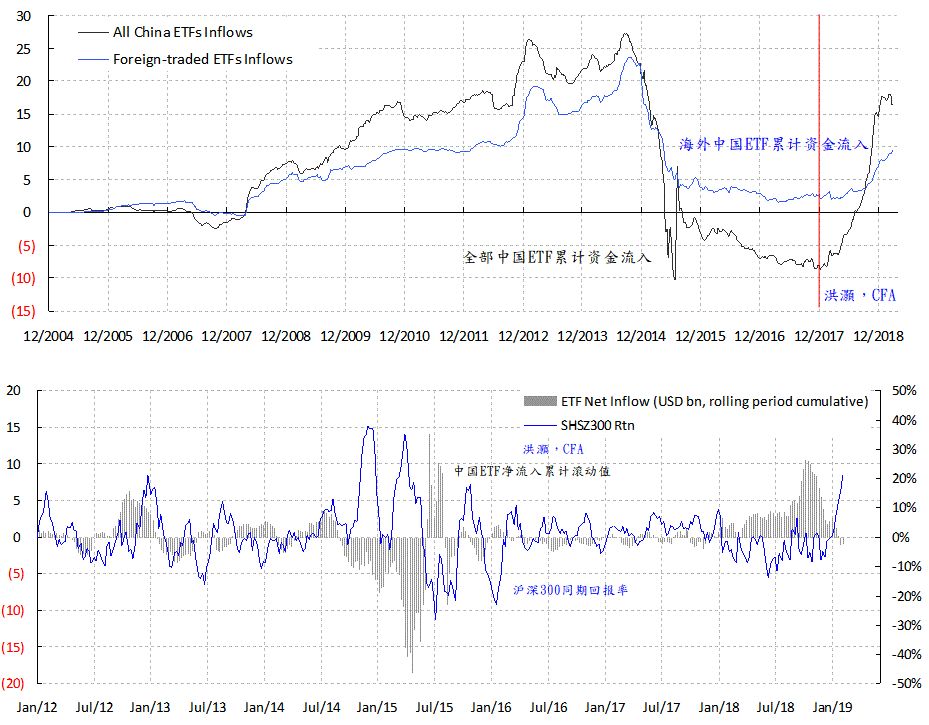
ETF中国指数基金和陆股通自2018年初以来一直处于买入状态,即使2018年市场的表现很差,创了历史记录。因此,这些所谓的外国买盘其实并没有市场择时效应。他们的买入对于预测市场前景是无效的。此外,ETF资金流入量已经开始减弱,甚至在未来几周内可能逆转。一些融资交易依靠香港较低的资金成本,通过陆股通进入A股市场。他们已经买爆了一些陆股通的标的。这些融资交易集中购买的公司平均股息收益率约为2%,抵消了这些交易部分的利息成本。出于对回报的憧憬,这些杠杆资金通过陆股通进入A股的动机仍然强烈。它们很有可能将继续成为市场波动的来源之一。
市场受阻,但长期趋势重于短期波动:
监管机构似乎不太可能在短期内对融资交易明确表态 - 就像2015年那样。那时,在监管最终掉头之前,融资交易规则经历了很多迂回。这种暂时难以明确的监管态度开启了投机的时间窗口,使近期市场的巨幅震荡反而成为了投机者的天堂。我们的短期交易模型预示着短期市场波动将飙升,交易员应谨慎而为。而我们的长期配置模型继续显示A股的估值有吸引力。这些由于交易周期不同而产生的相互矛盾的信号将逼仓短期交易者,让长期投资者接盘。这种市场强手、弱手之间的换岗,以及随之而来的、从短期到长期仓位的轮换势必将导致市场波动,并暂时扭曲风险与回报的比例。轮动甚至会让一些长期的持仓暂时显得得不偿失。然而对我们来说,此刻,长期趋势重于短期波动。
//这是我们20190310 的报告《
洪灝:
谁在买?谁会再买?
》的英文原版。感谢阅读。//
--------------------------
Summary
Prevalence of margin trades a source of volatility:
The torrid market ascent and then descent recently suggest strongly the prevalence of margin trades. Such epic volatility is reminiscent of 2015. How else could we explain the diverging YTD performance of Hong Kong and mainland markets driven by a similar set of fundamentals? We have investigated the buying behavior of strategic investors, margin traders, the Connect Schemes and ETFs. Except for strategic investors who are natural long in stocks and are thus prone to reduce their stakes, margin traders, the Connect Schemes and China-focused ETFs have all been buying – not surprising at all. Now, the more important question is what different buying mean for the market outlook.
Regulator’s tolerance towards margin trades unclear; Percentage turnover in margin trades as proxy:
The changes in margin trading activities have the closest correlation with the market surge. Whether the percentage of total turnover in margin trades can penetrate its upper limit of 12%, as suggested by the experiences in recent years, can be applied as a quantitative proxy to monitor the regulator’s tolerance towards margin trades. It is now close to 11%; the OTC financing in Guangdong is being investigated, and brokers are advised against working with the OTC financing vendors. But it is also reported that index futures trading could be normalized by year end. As such, the regulator’s attitude towards margin trades is for now inconclusive.
Margin trades with lower overseas interest rate buying via Connect:
ETF inflows and the Connect Schemes have been buying since early 2018. As such, this so-called foreign buying has little market timing potency, and forestalls little for the outlook. Further, ETF inflows have started to wane, and can even reverse in the coming weeks. Margin trades on lower HK interest rates have hit the buying limit on some of the constituents of the scheme. These margin trades have bought into companies with an average dividend yield of ~2%, offsetting some of their interest costs. With a prospect of handsome gains, the motive for these margin trades to buy into the mainland via the Connect Schemes is strong. They can also be a source of market volatility.
Long-term trend trumps short-term moves:
The regulators are unlikely to make up their mind towards margin trades shortly – much like in 2015 when there were many zigzags and eventually a U-turn. As such, the volatile market condition in the near term is a fertile ground for speculation. Our short-term trading model suggests caution, while our long-term allocation models continue to show attractive valuation for the A shares. Such conflicting messages will likely oblige short-term traders to hand over their positions to long-term investors. The consequent rotation from short to long term will induce volatility, skewing risk versus reward temporarily. Yet, to us, the long-term trend trumps short-term moves.
Who is Buying This Rally?
“Stay hungry, and stay foolish. Or watch your neighbors get rich - like an economist.” – Chinese stock market jibes
The other day, I was in the office elevator on my way to work. I couldn’t help but notice an unusual congregation of mum-and-pop investors packing the elevator with me. They were probably going to one of the brokers in the building to sort out their accounts. It felt good when fully loaded on our way up.
Suddenly, there was a tap on my shoulder. I turned and met a pair of earnest eyes.
“You are that guy,”
he grinned.
“I saw your show the other day. Could you please give me some tips?”
I was flattered; face blushing like a boiled lobster.
But before I had the opportunity to answer his question in the professional sell-side fashion, another pop nudged him and whispered:
“Don’t ask him. He has been in the market for too long. He wouldn’t dare to chase higher.”
The logic was so flawless for me to come back nicely in a short elevator ride.
“You should ask a newbie. They are gutsier. You will make more money.”
The elevator doors behind me squeezed out the final verdict.
…
Who bought this rally? It is a pertinent question besetting investors. But more importantly – what does it mean for the market outlook when different types of funds buy? Knowing the answer, or at least some approximate truth, will be the key to determine whether the show will go on.
Margin Trades
In our last note, we postulated that it was the margin trades that have been instrumental to the current surge (
“A Margin Bull. What’s Next?”
,
20190301
). After all, it would be difficult to explain the torrid volatility. Further, based on recent trading history since late 2015, when the percentage of total turnover in margin trades is close to its upper limit of ~12%, the regulator may intervene. And the latest data show that this percentage stays elevated at close to 11% (
Figure 1
).
Our report was published on Friday, March 1, 2019. The SSE50 blue chip index peaked out on the following Monday, March 4, 2019. From its peak to its last close, the blue chip index has declined by ~8%.
Already, it is reported that the CBIRC fined two banks in Taizhou for negligence of letting some of their loans into the stock market. Further, the CSRC Guangdong Branch was reported to have hosted a meeting regarding OTC margin financing, explicitly advising brokers not to cooperate with OTC financing companies as they did in 2015, and asking brokers to step up monitoring abnormal trading activities and to improve investor education. But the CSRC also mentioned briefly that it had been studying the feasibility of normalizing the stock index futures trading probably by year end. This news confirms that talks that have been on the street for some time.
Figure 1:
Margin trades as a percentage of turnover stays elevated and close to its limits since late 2015.
 Source: CEIC, BOCOM Int'l
These recent developments are consistent with past experiences as the percentage approached its upper limit. Going forward, we can apply this measure as a proxy of regulatory scrutiny, and as an alert of looming market resistance. When this percentage significantly penetrates its upper limit, it would suggest that regulators’ attitude towards margin trades is shifting, and it would be constructive to risk appetite – or even a repeat of the 2015 bubble.
But the calculation of this percentage is a dynamic process – as more and more cash trades crowd into the market, the percentage turnover in margin trades will decline, and the trajectory of the staggering surge will likely decelerate. As such, we need to investigate who else have been buying the rally.
ETF Inflows
Consensus also believes that it is the foreign inflows into China-focused funds that have been buying, implying that these buying has been pushing up the market. But the evidence in data is inconclusive. We note that these China-focused funds tend to be early in their buying, and slow the accumulation or even reduce stakes in the Chinese market as the indices rise.
For instance, the cumulative inflows of these ETFs climaxed in late 2014 – just before the Chinese market was about to soar. Then, the pace of buying started to decelerate, and later turned into net outflow as the market crashed (
Figure 2, upper panel
). Such behavioral patterns are most likely to be caused by investor’s planned fixed investments over time, as well as heavy redemptions as the market falls.
When comparing shorter-term, rolling periodical cumulative ETF inflows with the market return for the corresponding period, we can show that the speed of these funds’ inflow is a contrarian indicator of these funds’ return
(
Figure 2, lower panel
).
Given this historical relation between periodical return and cumulative inflow has been strong and persisting, and the market has been surging of late, we will likely see net outflows from these funds – opposite to the trend in the past few months. As such, these inflows, even if their buying has been supportive for the market, they are unlikely to continue to be as supportive for the market in the near term.
Figure 2: Inflows of China-focused ETFs, a contrarian indicator of return, are waning
.
Source: Bloomberg, BOCOM Int'l
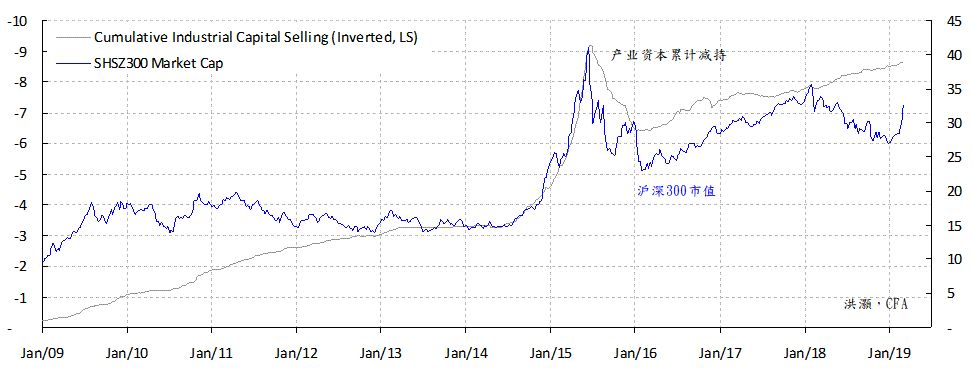
Strategic Investors (Industrial Capital)
Consensus also observes that strategic investors have been cutting their stakes amid this rally. In general, this is believed to be a bearish sign, as these monies tend to be long-term strategic partners with intertwining relationship with all facets of the listed companies. If they depart, it is assumed that retailed investors will be left holding the bag.
Once again, data evidence does not support such popular belief. Indeed, strategic investors have been reducing stakes all the way up or down, as seen by the close correlation between the cumulative reduction of stakes and the capitalization of the market (
Figure 3
). That is, as the natural long-only of the market after accumulating stakes in public companies, strategic investors could only reduce their stakes as the market rises. Their selling suggests quite little, but their buying may indeed suggest a market with value.
Figure 3: Industrial Capital, the natural longs, has been reducing its stakes regardless of market conditions.
Source: Bloomberg, Wind, BOCOM Int'l
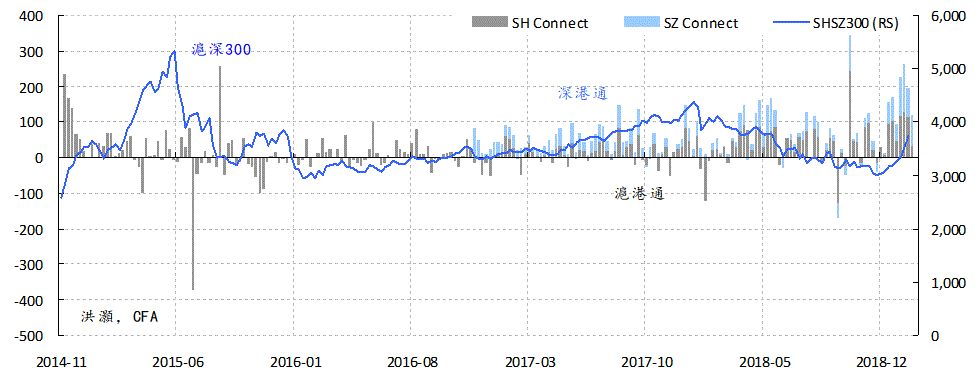
Connect Schemes
Can the strong inflows from Hong Kong through the Connect Schemes be the drivers of the current rally? Weekly inflow data of the schemes show that these monies are not very good market timers – they tend to buy regardless of market directions (
Figure 4
). As such, the connotation of their buying for the market is also inconclusive.
That said, there is evidence that margin traders borrowing from Hong Kong at a very cheap interest rate, and then going through the schemes into the mainland market. It is difficult to gauge the magnitude of these trades. But given the interest spread between the mainland and Hong Kong, as well as the prospects of handsome gains, the motive for such trades is strong. If so, this type of margin trades from Hong Kong will be an additional source of market volatility in the near future.
Figure 4: Buying through connect schemes has been surging, but it has little market timing power.
Source: Bloomberg, Wind, BOCOM Int'l
Market Outlook