Whenever we decide to go out, we always check the forecast for the day. We usually do this on the news channels or with the help of our mobile phones. It helps us decide if we need an umbrella for the day or if we need our sunglasses. The weather forecast even notifies people of certain weather events well into the future so that they can prepare themselves for it. It has made our lives so easy, but have you ever wondered how the news channels know what the weather is going to be like?
How does it work?
The answer to this timeless question lies in mathematics and observational data. Various sources, such as weather stations, satellites, sea buoys, commercial airliners and ships gather data all around the world. Yes, even your airplane is a source of data! In total, billions of observations are made every single day.

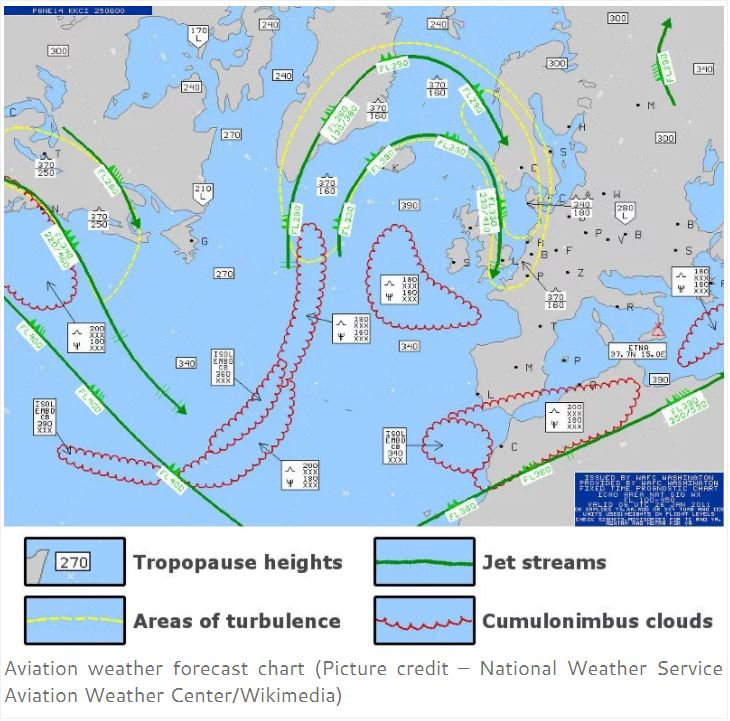
Regular PCs or the laptop I used to type this article cannot analyze data of this size. Instead, it is analyzed with the use of supercomputers that boast amazing computational powers. The supercomputers at the National Oceanic and Atmospheric Administration can complete 2.8 quadrillion calculations (yes, you read that correctly. 1 Quadrillion is 1015) every second! Scientists use these supercomputers to generate forecasts. They also use mathematical models that are based on past weather patterns and the geography of that particular region.Below is an image of what a regular forecast chart looks like. The yellow dashed line represents areas of moderate or high turbulence, while the scalloped lines represent cumulonimbus clouds, which are basically thunderstorm clouds. These areas have higher chances of storms and hails. The green lines indicate jet streams, which are near the core of maximum winds.
What is this ‘observational data’?
Many of you must be wondering what ‘observational data’ actually means. It is a list of things that affect the weather in one way or another. However, keep in mind that everything has its own significance.
Temperature and Humidity
One of the things that we observe on a day-to-day basis is temperature. An increase in temperature is most likely to cause a direct increase in evaporation. This will result in a high amount of humidity, which increases the chances of rain, hail or snow.
Pressure and Winds
The next two things are pressure and wind. According to the level of pressure, the regions come in two types – high-pressure regions and low-pressure regions. High-pressure regions have air with high density and vice versa. Now, we know that things always move from high-density areas to low-density areas. Similarly, winds start flowing from high-pressure regions to low-pressure regions. The speed is decided by the difference in pressure. If the difference is large, the speed will be faster. The variation in temperature between these two regions also has notable effects, leading to regular rainfall/snowfall, or in some cases, thunderstorms/tornadoes.

Dew Point