专栏名称: 编程派
Python程序员都在看的公众号,跟着编程派一起学习Python,看最新国外教程和资源!
目录
相关文章推荐
Python爱好者社区  ·  深度学习“四大名著”发布 ·  3 天前  
Python爱好者社区  ·  商汤科技,爆了。。。 ·  3 天前  
Python爱好者社区  ·  ML书.pdf ·  6 天前  
Python爱好者社区  ·  商汤科技,彻底爆了 ·  6 天前  
Python中文社区  ·  用 Python 打造加密货币实时价格追踪器 ·  6 天前  
51好读  ›  专栏  ›  编程派

scikit-learn机器学习初体验

编程派  · 公众号  · Python  · 2017-02-17 11:32

正文

AI这么火,而且又大多用Python来写。这么好的条件,作为Python粉的你能不学点吗?

作者:xhrwang

原文链接:http://xhrwang.me/2015/02/13/scikit_learn-tutorial.html 

本文约 5914 字,读完可能需要 9 分钟。

Why

机器学习在图像和语音识别领域已经有很多成熟的应用,比如:

  • 图像识别,比如人脸识别

  • 机器翻译

  • 语音输入

那机器学习究竟是如何做到这些的呢?本文以图像识别中比较简单的数字识别为例来了解一下。

What

scikit-learn 是一个用于数据挖掘和分析的 Python 库,完全开源并封装了很多机器学习的算法,我们可以很方便得对其提供的 SVM 算法进行训练并将其用于实际应用场景,解决一些数据量不是很大的问题。

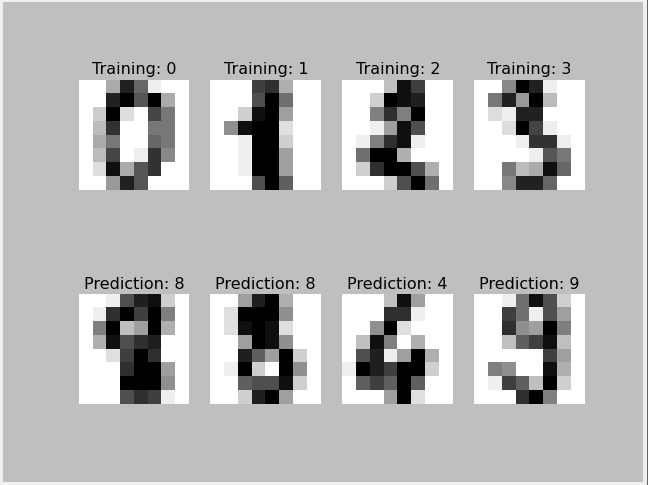
下面的例子将演示如何使用 sklearn 库中提供的数字图片 dataset 来识别它们表示的实际数字。

最后画出的图形为:
How

安装 scikit-learn

根据 numpy 官方文档 的说明,官方发布的 源码和包在 SourceForge 上。那么分别从下面的地址下载安装最新 release 版本:

解决了依赖项问题之后,通过下面的命令安装 sklearn

  1. pip install - U scikit-learn

一个手写数字识别的例子

scikit_learn 官方有个例子,使用 sklearn 自带的 dataset 对算法进行训练并用于手写数字识别的例子。

准备工作

  • 按照本文前半部分的步骤安装sklearn

  • 安装 matplotlib的依赖库 dateutil

  1. pip install  python-dateutil

  • 安装 matplotlib 的依赖库 pyparsing

  1. pip install  pyparsing

Python 代码:

  1. # -*- coding: utf-8 -*-

  2. """

  3. ================================

  4. Recognizing hand-written digits

  5. ================================

  6. An example showing how the scikit-learn can be used to recognize images of

  7. hand-written digits.

  8. This example is commented in the

  9. :ref:`tutorial section of the user manual `.

  10. """

  11. # 打印出上面的文档信息,Python 里面使用 """

  12. # 多行注释的信息被当作文档信息,可以对源代码、类、方法等进行注释从而生成文档,是自解释的机制

  13. print(__doc__)

  14. # 下面是 scikit----learn 官方例子的作者信息

  15. # Author: Gael Varoquaux

  16. # License: BSD 3 clause

  17. # 导入用于科学计算的库

  18. import matplotlib.pyplot as plt

  19. # 导入 sklearn 自带的手写数字 dataset,以及进行机器学习的模块

  20. from sklearn import datasets, svm, metrics

  21. # 加载 sklearn 自带的手写数字 dataset

  22. digits = datasets.load_digits()

  23. # 这里我们感兴趣的数据是不同灰度的 8x8 个小格子组成的图像

  24. # 如果我们直接使用图像进行处理,就需要使用 pylab.imread 来加载图像数据,而且这些图像数据必须都是 8x8 的格式

  25. # 对于这个 dataset 中的图像,dataset.target 给出了它们实际对应的数字

  26. images_and_labels = list(zip(digits.images, digits.target))

  27. for index, (image, label) in enumerate(images_and_labels[:4]):

  28.    plt.subplot(2, 4, index + 1)

  29.    plt.axis('off')

  30.    plt.imshow(image, cmap=plt.cm.gray_r, interpolation='nearest')

  31.    plt.title('Training: %i' % label)

  32. # 为了使用分类器,需要将每个表示手写图像的 8x8 数字转换为一个数字数组

  33. # 这样 digits.images 就变为了(采样,采样特性)的一个矩阵

  34. n_samples = len(digits.images)

  35. data = digits.images.reshape((n_samples, -1))

  36. print(digits.images[0])

  37. print(data[0])

  38. # 创建一个分类器,这里 gamma 的值是给定的,可以通过 grid search 和 cross validation 等技术算出更好的值。

  39. # 下面的链接有个例子是自己算 gamma:

  40. # http://efavdb.com/machine-learning-with-wearable-sensors/

  41. classifier = svm.SVC(gamma=0.001)

  42. # 用前半部分数据训练分类器

  43. classifier.fit(data[:n_samples / 2], digits.target[:n_samples / 2])

  44. # 对后半部分数据使用训练好的分类器进行识别

  45. expected = digits.target[n_samples / 2:]

  46. predicted = classifier.predict(data[n_samples / 2:])

  47. # 打印分类器的运行时信息以及期望值和实际识别的值

  48. print("Classification report for classifier %s:n%sn"

  49.      % (classifier, metrics.classification_report(expected, predicted)))

  50. print("Confusion matrix:n%s" %

  51.      metrics.confusion_matrix(expected, predicted))

  52. # 画出手写数字的图像并给出识别出的值

  53. images_and_predictions = list(

  54.    zip(digits.images[n_samples / 2:], predicted))

  55. for index, (image, prediction) in enumerate(images_and_predictions[:4]):

  56.    plt.subplot(2, 4, index + 5)

  57.    plt.axis('off')

  58.    plt.imshow(image, cmap=plt.cm.gray_r, interpolation='nearest')

  59.    plt.title('Prediction: %i' % prediction)

  60. plt.show()

下面的代码将输出注释中提到的将 8 x 8 数字矩阵转换为数组:

  1. n_samples = len(digits.images)

  2. data = digits.images.reshape((n_samples, -1))

  3. print("Number picture matrix:")

  4. print(digits.images[0])

  5. print("flatten array:")

  6. print(data[0])

其输出为:

  1. Number picture matrix:

  2. [[0.   0.   5.  13.   9.   1.   0.   0.]

  3. [0.   0.  13.  15.  10.  15.   5.   0.]

  4. [0.   3.  15.   2.   0.  11.   8.   0.]

  5. [0.   4.  12.   0.   0.   8.   8.   0.]

  6. [0.   5.   8.   0.   0.   9.   8.   0.]

  7. [0.   4.  11.   0.   1.  12.   7.   0.]

  8. [0.   2.  14.   5.  10.  12.   0.   0.]

  9. [0.   0.   6.  13.  10.   0.   0.   0.]]

  10. flatten array:

  11. [0.   0.   5.  13.   9.   1.   0.   0.   0.   0.  13.  15.  10.  15.   5.

  12. 0.   0.   3.  15.   2.   0.  11.   8.   0.   0.   4.  12.   0.   0.   8.

  13. 8.   0.   0.   5.   8.   0.   0.   9.   8.   0.   0.   4.  11.   0.   1.

  14. 12.   7.   0.   0.   2.  14.   5.  10.  12.   0.   0.   0.   0.   6.  13.

  15. 10.   0.   0.   0.]

从结果看,识别率已经很高,如果有更多更多样化的训练数据并且自己算 gamma 参数的话,结果还能更好:

  1.             precision    recall  f1 - score   support

  2.          0       1.00      0.99      0.99        88

  3.          1       0.99      0.97      0.98        91

  4.          2       0.99      0.99      0.99        86

  5.          3       0.98      0.87      0.92        91

  6.          4       0.99      0.96      0.97        92

  7.          5       0.95      0.97      0.96        91

  8.          6       0.99      0.99      0.99        91

  9.          7       0.96      0.99      0.97        89

  10.          8       0.94      1.00      0.97        88

  11.          9       0.93      0.98      0.95        92

  12. avg / total       0.97      0.97      0.97       899


题图:pexels,CC0 授权。

点击阅读原文,查看更多 Python 教程和资源。

推荐文章
Python爱好者社区  ·  深度学习“四大名著”发布
3 天前
Python爱好者社区  ·  商汤科技,爆了。。。
3 天前
Python爱好者社区  ·  ML书.pdf
6 天前
Python爱好者社区  ·  商汤科技,彻底爆了
6 天前
Python中文社区  ·  用 Python 打造加密货币实时价格追踪器
6 天前
覃汉研究笔记  ·  【国君固收】CL 171010
7 年前
绘画联盟  ·  和张大千有一拼的“末代王孙”
7 年前