ggtext让ggplot2图像也可以使用html、markdown及css语法,丰富了ggplot2文本的表现力。
在主题部分如坐标轴标题、坐标轴标签、图形标题、副标题、脚注等,可以使用html、markdown及css语法的文本,然后在theme函数中使用element_markdown和element_textbox进行渲染即可。
在panel区域,也就是类似于原生的geom_text或者geom_label的图层所作用的区域,可以使用geom_richtext或者geom_textbox来扩展文本标注的表现力。
element_markdown
element_markdown可以渲染html、markdown及css语法,获得高级的文本表现。
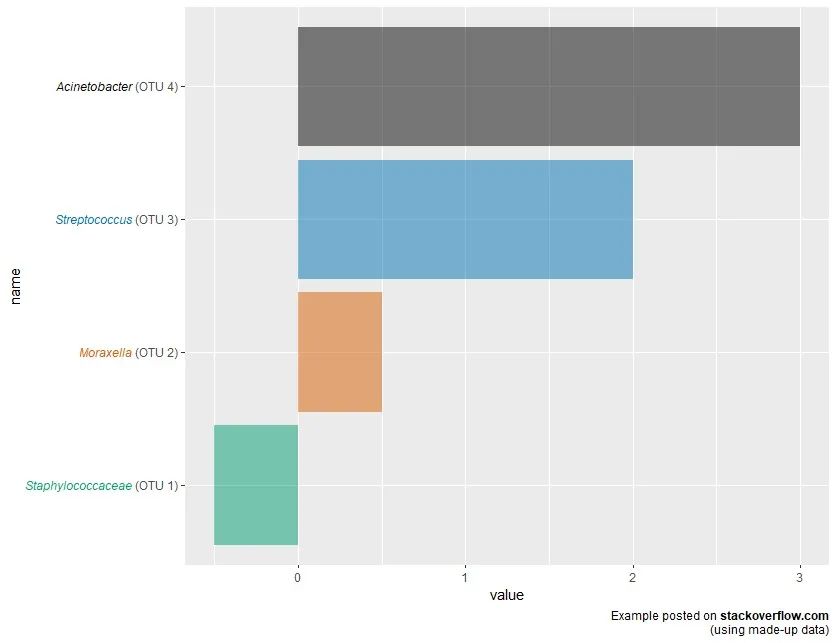
下图中可以看到,y轴标签使用了html的标记和css语法,改变文字为倾斜和不同颜色。脚注基本上是markdown语法,加了一个html换行标签。
data   bactname = c("Staphylococcaceae", "Moraxella", "Streptococcus", "Acinetobacter"),
  OTUname = c("OTU 1", "OTU 2", "OTU 3", "OTU 4"),
  value = c(-0.5, 0.5, 2, 3)
)

data %>% mutate(
  color = c("#009E73", "#D55E00", "#0072B2", "#000000"),
  name = glue("{bactname} ({OTUname})"),
  name = fct_reorder(name, value)
)  %>%
  ggplot(aes(value, name, fill = color)) +
  geom_col(alpha = 0.5) +
  scale_fill_identity() +
  labs(caption = "Example posted on **stackoverflow.com**
(using made-up data)") +
  theme(
    axis.text.y = element_markdown(),
    plot.caption = element_markdown(lineheight = 1.2)
  )
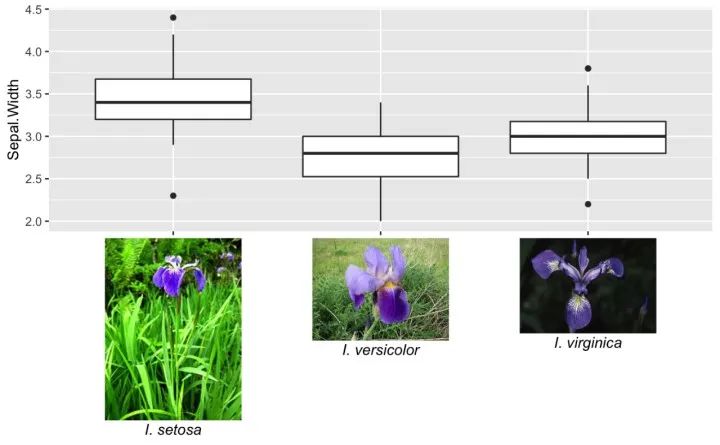
html的img标签其实也是支持的,但是目前貌似出现了bug,无法出图。正常情况下应该如下图所示:
labels setosa = "![]() width='100' />
width='100' />
*I. setosa*",
virginica = "![]() width='100' />
width='100' />
*I. virginica*",
versicolor = "![]() width='100' />
width='100' />
*I. versicolor*"
)
ggplot(iris, aes(Species, Sepal.Width)) +
geom_boxplot() +
scale_x_discrete(
name = NULL,
labels = labels
) +
theme(
axis.text.x = element_markdown(color = "black", size = 11)
)
element_textbox
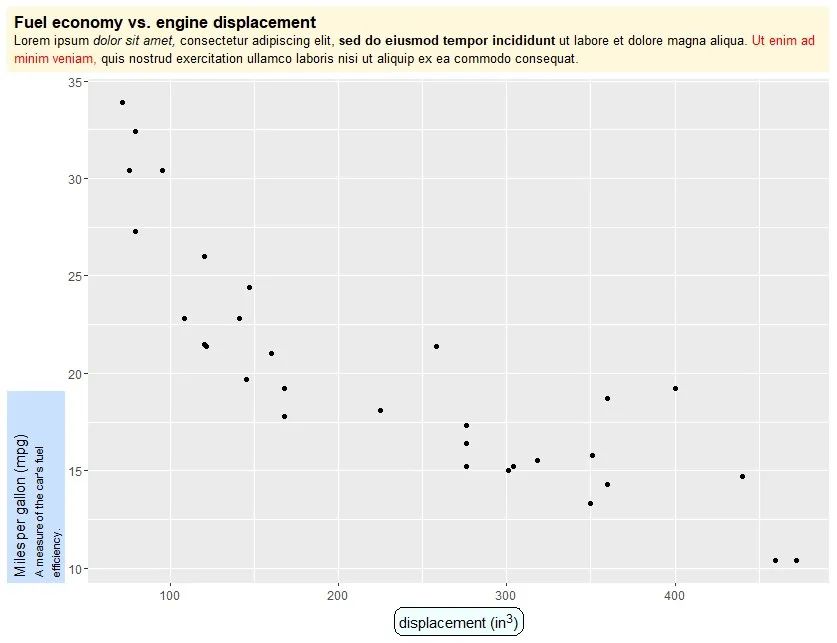
element_textbox可以让长文本自动折叠,但是它在轴标签上无法使用。文本的旋转角度也不能是任意的,只能是0、90、180、270。
一般情况下不使用element_textbox,而是使用element_textbox_simple,它和element_textbox是一样的,只不过更加容易使用,很多默认参数都已经设置好了。
ggplot(mtcars, aes(disp, mpg)) +
geom_point() +
labs(
title = "Fuel economy vs. engine displacement
Lorem ipsum *dolor sit amet,*
consectetur adipiscing elit, **sed do eiusmod tempor incididunt** ut
labore et dolore magna aliqua. Ut enim
ad minim veniam, quis nostrud exercitation ullamco laboris nisi
ut aliquip ex ea commodo consequat.",
x = "displacement (in3)"
,
y = "Miles per gallon (mpg)
A measure of
the car's fuel efficiency."
) +
theme(
plot.title.position = "plot",
plot.title = element_textbox_simple(
size = 13,
lineheight = 1,
padding = margin(5.5, 5.5, 5.5, 5.5),
margin = margin(0, 0, 5.5, 0),
fill = "cornsilk"
),
axis.title.x = element_textbox_simple(
width = NULL,
padding = margin(4, 4, 4, 4),
margin = margin(4, 0, 0, 0),
linetype = 1,
r = grid::unit(8, "pt"),
fill = "azure1"
),
axis.title.y = element_textbox_simple(
hjust = 0,
orientation = "left-rotated",
minwidth = unit(1, "in"),
maxwidth = unit(2, "in"),
padding = margin(4, 4, 2, 4),
margin = margin(0, 0, 2, 0),
fill = "lightsteelblue1"
)
)
element_box在使用上非常有意思的一个地方是可以修改分面图的strip格式,如下图所示。
ggplot(mpg, aes(cty, hwy)) +
  geom_point() +
  facet_wrap(~class) +
  cowplot::theme_half_open(12) +
  cowplot::background_grid() +
  theme(
    strip.background = element_blank(),
    strip.text = element_textbox(
      size = 12,
      color = "white", fill = "#5D729D", box.color = "#4A618C",
      halign = 0.5, linetype = 1, r = unit(5, "pt"), width = unit(1, "npc"),
      padding = margin(2, 0, 1, 0), margin = margin(3, 3, 3, 3)
    )
  )
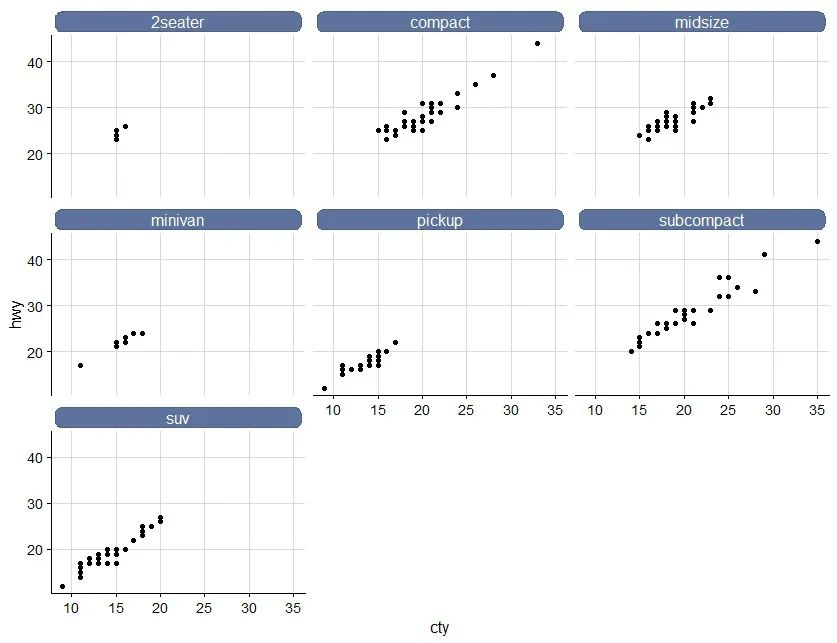
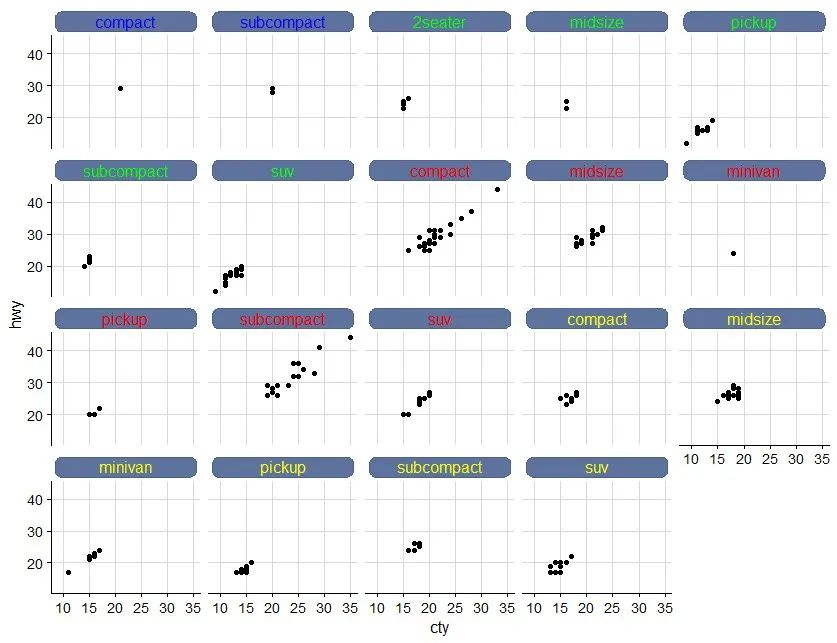
上图是固定的格式显示,strip的格式都是一样的,其实也可以更进一步,将strip按照分组显示,从而实现多一个维度的信息展示,比如此图的stipe文本是class信息(因为这里的分面是facet_wrap(~class)控制的),那么可以将原始的数据的class格式化为一个html的标记,下图就是将strip的字体颜色映射为mpg中的cyl变量,当然了由于class中存在多种cyl信息,因此被拆分成了多个子图,这也是正常情况。如果要和以前一样的子图数量,其实可以按照class的水平值,各自组合一个颜色即可。
mpg %>% mutate(cyl = fct_recode(factor(cyl),
                                red = "4",
                                blue = "5",
                                yellow = "6",
                                green = "8")) %>%
  mutate(class = str_glue("{class}")) %>%
  ggplot(aes(cty, hwy)) +
    geom_point() +
    facet_wrap(~class) +
    cowplot::theme_half_open(12) +
    cowplot::background_grid() +
    theme(
      strip.background = element_blank(),
      strip.text = element_textbox(
        size = 12,
        color = "white", fill = "#5D729D", box.color = "#4A618C",
        halign = 0.5, linetype = 1, r = unit(5, "pt"), width = unit(1, "npc"),
        padding = margin(2, 0, 1, 0), margin = margin(3, 3, 3, 3)
      )
    )
geom_richtext
geom_richtext和基础图层geom_text或者geom_label类似,但是扩增了很多格式控制。
df   label = c(
    "Some text **in bold.**",
    "Linebreaks
Linebreaks
Linebreaks",
    "*x*2 + 5*x* + *C**i*",
    "Some blue text **in bold.**
And *italics text.*

    And some large text."
  ),
  x = c(.2, .1, .5, .9),
  y = c(.8, .4, .1, .5),
  hjust = c(0.5, 0


