
数据挖掘入门与实战 公众号: datadw
1.异常值和缺失值的处理
这绝对是数据分析时让所有人都头疼的问题。异常和缺失值会破坏数据的分布,并且干扰分析的结果,怎么处理它们是一门大学问,而我根本还没入门。
(1)异常值
3 ways to remove outliers from your data
https://ocefpaf.github.io/python4oceanographers/blog/2015/03/16/outlier_detection/
提供了关于如何对时间序列数据进行异常值检测的方法,作者认为
移动中位数
的方法最好,代码如下:
from pandas import rolling_median
threshold = 3 df['pandas'] =
rolling_median(df['u'], window=3, center=True)
.fillna(method='bfill').fillna(method='ffill')
difference = np.abs(df['u'] - df['pandas'])
outlier_idx = difference > threshold
rolling_median
函数详细说明参见
pandas.rolling_median
http://pandas.pydata.org/pandas-docs/version/0.17.0/generated/pandas.rolling_median.html
(2)缺失值
缺失值在DataFrame中显示为
nan
,它会
导致ARMA无法拟合
,因此一定要进行处理。
a.用序列的均值代替,这样的好处是在计算方差时候不会受影响。但是连续几个
nan
即使这样替代也会在差分时候重新变成
nan
,从而影响拟合回归模型。
b.直接删除。我在很多案例上看到这样的做法,但是当一个序列中间的
nan
太多时,我无法确定这样的做法是否还合理。
2.平稳性检验
序列平稳性是进行时间序列分析的前提条件,主要是运用ADF检验。
from statsmodels.tsa.stattools import adfullerdef test_stationarity(timeseries):
dftest = adfuller(timeseries, autolag='AIC') return dftest[1]
adfuller
函数详细说明参见
statsmodels.tsa.stattools.adfuller
http://www.statsmodels.org/devel/generated/statsmodels.tsa.stattools.adfuller.html?highlight=adfuller#statsmodels.tsa.stattools.adfuller
3.不平稳的处理
(1)对数处理。对数处理可以减小数据的波动,因此无论第1步检验出序列是否平稳,都最好取一次对数。关于为什么统计、计量学家都喜欢对数的原因,知乎上也有讨论:
在统计学中为什么要对变量取对数?
https://www.zhihu.com/question/22012482
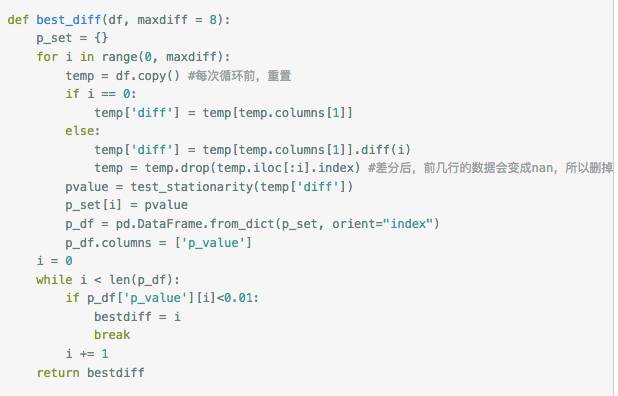
(2)差分。一般来说,非纯随机的时间序列经一阶差分或者二阶差分之后就会变得平稳。那差分几阶合理呢?我的观点是:
在保证
ADF检验的p<0.01
的情况下,阶数越小越好
,否则会带来样本减少、还原序列麻烦、预测困难的问题。——这是我的直觉,还没有查阅资料求证。基于这样的想法,构造了选择差分阶数的函数:
(3)平滑法。利用移动平均的方法来处理数据,可能可以用来处理周期性因素,我还没实践过。
(4)分解法。将时间序列分解成长期趋势、季节趋势和随机成分,同样没实践过。
对于(3)(4),参见《
python时间序列分析
》或者
Complete guide to create a Time Series Forecast (with Codes in Python)
时间序列预测全攻略(附带Python代码)
4.随机性检验
只有时间序列不是一个白噪声(纯随机序列)的时候,该序列才可做分析。
时间序列ARIMA模型详解:python实现店铺一周销售量预测
from statsmodels.stats.diagnostic import acorr_ljungboxdef test_stochastic(ts):
p_value = acorr_ljungbox(ts, lags=1)[1]
return p_value
acorr_ljungbox
函数详细说明参见
statsmodels.stats.diagnostic.acorr_ljungbox
http://www.statsmodels.org/devel/generated/statsmodels.stats.diagnostic.acorr_ljungbox.html?highlight=acorr_ljungbox#statsmodels.stats.diagnostic.acorr_ljungbox
5.确定ARMA的阶数
ARMA(p,q)是AR(p)和MA(q)模型的组合,关于p和q的选择,一种方法是观察自相关图ACF和偏相关图PACF,
另一种方法是通过借助AIC、BIC统计量自动确定。由于我有几千个时间序列需要分别预测,所以选取自动的方式,而BIC可以有效应对模型的过拟合,因而选定BIC作为判断标准。
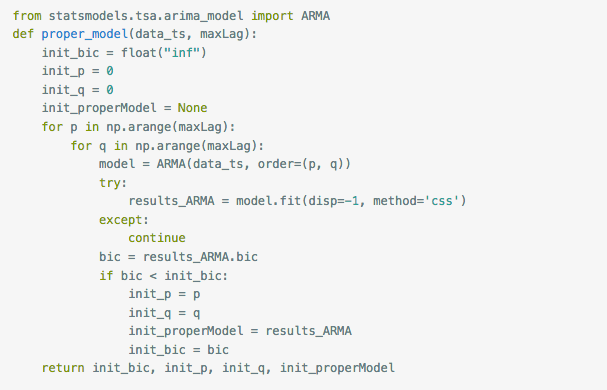
这个函数的原理是,根据设定的
maxLag
,通过循环输入p和q值,选出拟合后BIC最小的p、q值。
然而在
statsmodels
包里还有更直接的函数:
import statsmodels.tsa.stattools as st
order = st.arma_order_select_ic(timeseries,max_ar=5,max_ma=5,ic=['aic',
'bic', 'hqic'])
order.bic_min_order
timeseries
是待输入的时间序列,是
pandas.Series
类型,
max_ar
、
max_ma
是
p
、
q
值的最大备选值。
order.bic_min_order
返回以BIC准则确定的阶数,是一个
tuple
类型
6.拟合ARAM
from statsmodels.tsa.arima_model import


