昨天,笔者讲述了如何将CPU和IO撑满,这个其实很好理解,写个CPU密集型的程序让CPU忙个不停就可以撑满CPU;
弄个程序一直写就可以让IO也撑满。
有兴趣的同学可以看下昨天的这篇文章《
看我如何作死 | 将CPU、IO撑满
》,不过里面的做法分别是使用openssl speed和linux dd工具来实现这两个功能。
面对CPU和IO时,相信大家都能很快的反应出如何实现,那么面对网络问题时,大家的反应又是如何呢?
不会是拔网线吧。
。
。
在故障注入,或者说故障演练,甚至说混沌工程中,可以设计很多类型的故障,今天要介绍的就是网络故障。
混沌系统是在分布式系统上进行实验的学科,目的是建立对系统抵御生产环境中失控条件的能力以及信心。
在复杂的网络环境下,数据包发送和接收的时间间隔或长或短。
在网络状况较差时,调用下游服务时可能要过很久才能收到返回,这时服务的反应如何,直接关系到稳定性与高可用。
我们这里索要模拟的网络故障有三类,分别是:
网络延时、网络中断以及网络丢包。
一、tc工具介绍
笔者也不卖关子,本文模拟的网络故障是通过linux的tc工具来实现的。
Linux内核网络协议栈从2.2.x开始,就实现了对服务质量的支持模块。
具体的代码位于net/sched/目录。
在Linux里面,对这个功能模块的称呼是Traffic Control ,简称TC。
TC是一个在上层协议处添加Qos功能的工具,原理上看,它实质是专门供用户利用内核Qos调度模块去定制Qos的中间件。
Linux操作系统中的流量控制器TC(Traffic Control)用于Linux内核的流量控制,主要是通过在输出端口处建立一个队列来实现流量控制。
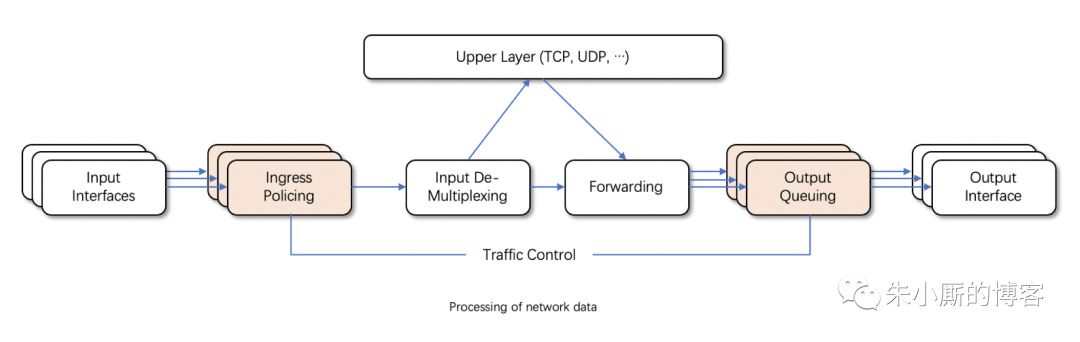
接收包从输入接口(Input Interface)进来后,经过流量限制(Ingress Policing)丢弃不符合规定的数据包,由输入多路分配器(Input De-Multiplexing)进行判断选择:
如果接收包的目的是本主机,那么将该包送给上层处理;
否则需要进行转发,将接收包交到转发块(Forwarding Block)处理。
转发块同时也接收本主机上层(TCP、UDP等)产生的包。
转发块通过查看路由表,决定所处理包的下一跳。
然后,对包进行排列以便将它们传送到输出接口(Output Interface)。
一般我们只能限制网卡发送的数据包,不能限制网卡接收的数据包,所以我们可以通过改变发送次序来控制传输速率。
Linux流量控制主要是在输出接口排列时进行处理和实现的。
tc工具的语法还是很复杂的,笔者(微信公众号:
朱小厮的博客)试图想要在本文中详细的讲解一下tc的用法,最后还是放弃了,篇幅太长,难以穷尽。
所以本文中只是针对前面说的三种故障简单的演示一下tc的用法以及对应故障的实现方式,希望能够能大家有个小小的印象。
如果以后遇到类似问题,或者说对这个东西感兴趣,可以再深度的学习一下。
二、paping工具介绍
在正式介绍如何模拟网络故障之前,还要介绍一个工具来查看模拟的效果如何。
通常我们测试数据包能否通过IP协议到达特定主机,都习惯使用Ping命令,工作时发送一个ICMP Echo,等待接受Echo响应,但是Ping使用的是ICMP协议,如果防火墙放通了此协议,依旧能够ping通,但是无法确定通过tcp传送的数据包是否正常到达对端。
而paping可以在Linux平台上测试网络的连通性及网络延时等。
它的用法很简单:
-p, --port N 指定被测试服务的 TCP 端口(必须);
--nocolor 屏蔽彩色输出;
-t, --timeout 指定超时时长,单位为毫秒,默认值为 1000;
-c, --count N 指定测试次数。
比如下面的示例(记得先要开启一个以80为端口的服务, 示例中的xxx.xxx.xxx.xxx代表ip地址):
hidden@hidden$ ./paping -p 80 -c 5 xxx.xxx.xxx.xxx
paping v1.5.5 - Copyright (c) 2011 Mike Lovell
Connecting to xxx.xxx.xxx.xxx on TCP 80:
Connected to xxx.xxx.xxx.xxx: time=27.47ms protocol=TCP port=80
Connected to xxx.xxx.xxx.xxx: time=97.83ms protocol=TCP port=80
Connected to xxx.xxx.xxx.xxx: time=37.38ms protocol=TCP port=80
Connected to xxx.xxx.xxx.xxx: time=57.62ms protocol=TCP port=80
Connected to xxx.xxx.xxx.xxx: time=71.87ms protocol=TCP port=80
Connection statistics:
Attempted = 5, Connected = 5, Failed = 0 (0.00%)
Approximate connection times:
Minimum = 27.47ms, Maximum = 97.83ms, Average = 58.43ms
可以看到平均链接时间为58.43ms。
如果你的机器上没有安装paping,那么可以采用如下的方式安装:
wget https://storage.googleapis.com/google-code-archive-downloads/v2/code.google.com/paping/paping_1.5.5_x86_linux.tar.gz
tar -zvxf paping_1.5.5_x86_linux.tar.gz
 ./paping -p 80 -c 5000 www.baidu.com
如果有以下的错误:
./paping: error while loading shared libraries: libstdc++.so.6: cannot open shared object file: No such file or directory
可以先安装对应的库来解决:
sudo apt-get install libstdc++6
sudo apt-get install lib32stdc++6
三、模拟网络延时
使用tc命令模拟延迟300ms(对应的删除命令为tc qdisc del dev eth0 root netem):
 tc qdisc add dev eth0 root netem delay 300ms
// 该命令将网卡eth0的传输设置为延迟300ms发送
此时再次执行paping命令:
hidden@hidden$ ./paping -p 80 -c 5 xxx.xxx.xxx.xxx
paping v1.5.5 - Copyright (c) 2011 Mike Lovell

Connecting to xxx.xxx.xxx.xxx on TCP 80:

Connected to xxx.xxx.xxx.xxx : time=326.11ms protocol=TCP port=80
Connected to xxx.xxx.xxx.xxx : time=417.02ms protocol=TCP port=80
Connected to xxx.xxx.xxx.xxx : time=326.94ms protocol=TCP port=80
Connected to xxx.xxx.xxx.xxx : time=326.19ms protocol=TCP port=80
Connected to xxx.xxx.xxx.xxx : time=353.51ms protocol=TCP port=80

Connection statistics:
    Attempted = 5, Connected = 5, Failed = 0 (0.00%)
Approximate connection times:
    Minimum = 326.11ms, Maximum = 417.02ms, Average = 349.95ms
与之前的58.43ms相比相差了291.52ms ≈ 300ms。
更真实的情况下,延迟值不会这么精确,会有一定的波动,我们可以用下面的情况来模拟出带有波动性的延迟值:
 tc qdisc add dev eth0 root netem delay 300ms 50ms
//该命令将 eth0 网卡的传输设置为延迟 300ms ± 50ms (250 ~ 350 ms 之间的任意值)发送
四、模拟网络中断
这次使用如下的命令:
tc qdisc add dev eth0 root netem corrupt 10%
//该命令将 eth0 网卡的传输设置为随机产生 10% 的损坏的数据包
此时再次执行paping命令:
./paping -p 80 -c 100 xxx.xxx.xxx.xxx
注意这里的次数改成了100,为了更能清楚的看到中断的实际效果。
运行这个命令的过程中,会有“Connection timed out”字样报出,类似:
Connected to xxx.xxx.xxx.xxx: time=26.26ms protocol=TCP port=80
Connection timed out
Connected to xxx.xxx.xxx.xxx: time=65.10ms protocol=TCP port=80
Connection timed out
Connected to xxx.xxx.xxx.xxx: time=26.50ms protocol=TCP port=80
Connected to xxx.xxx.xxx.xxx: time=25.93ms protocol=TCP port=80


