数据可视化是数据分析中关键的一步,相比于静态绘图,交互(界面)图可以给我们更多的调节空间。单细胞数据分析中往往需要用不同的参数来可视化细胞图谱或者基因表达特征,Seurat也中有相关的交互绘图功能。而随着单细胞技术的普及,很多刚开始接触编程或者没有接触过编程的朋友也开始有了分析单细胞数据需求,于是有了SeuratV3Wizard这样的完全交互的Seurat平台。在Seurat
V4 版本中,也官方地提出了其交互平台(Shiny
app):azimuth 并且内置了PBMC的参考数据集,可以在线分析和注释。本期Seurat weekly 就和大家探索一下Seurat
的交互系统。
在Seurat中交互的参数一般是
interactive
,我们需要找到哪些函数有这个参数。思考:如何查一个R包中哪些函数有某一参数?
先载入R包和数据,并执行简单的降维。
library(Seurat)
packageVersion('Seurat')
[1] ‘3.2.2’
library(SeuratData)
library(tidyverse)
head(stxBrain.SeuratData::[email protected])
                   orig.ident nCount_Spatial nFeature_Spatial slice   region
AAACAAGTATCTCCCA-1  anterior1          13069             4242     1 anterior
AAACACCAATAACTGC-1  anterior1          37448             7860     1 anterior
AAACAGAGCGACTCCT-1  anterior1          28475             6332     1 anterior
AAACAGCTTTCAGAAG-1  anterior1          39718             7957     1 anterior
AAACAGGGTCTATATT-1  anterior1          33392             7791     1 anterior
AAACATGGTGAGAGGA-1  anterior1          20955             6291     1 anterior
# Loading required package: shiny
stxBrain.SeuratData::anterior1 %>% NormalizeData() %>% FindVariableFeatures() %>% ScaleData() %>% RunPCA() -> anterior1
我们发现有这个参数的函数有:
我们看到它们是配对的,演示一个先:
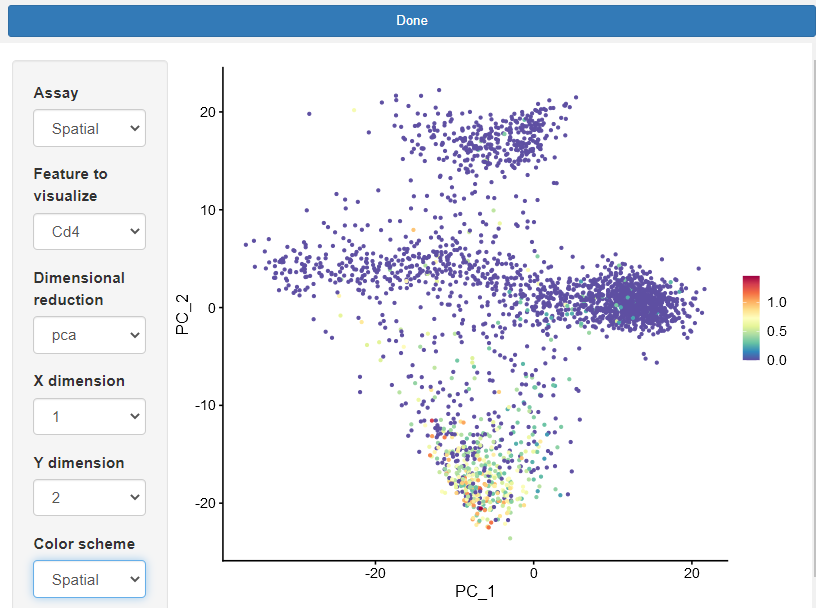
FeaturePlot(anterior1,feature= "Cd4",interactive = T)
Listening on http://127.0.0.1:6388
那我们肯定想知道它是如何实现的了,我们选择用debug的方式来查看原函数:
debug(FeaturePlot)
FeaturePlot(anterior1,feature= "Cd4",interactive = T)
函数太长,我们只看其中和交互有关的地方。
 ui "done",
    label = "Done", primary = TRUE)), miniContentPanel(fillRow(sidebarPanel(selectInput(inputId = "assay",
    label = "Assay", choices = assays.use, selected = assay,
    selectize = FALSE, width = "100%"), selectInput(inputId = "feature",
    label = feature.label, choices = features, selected = feature,
    selectize = FALSE, width = "100%"), selectInput(inputId = "reduction",
    label = "Dimensional reduction", choices = Reductions(object = object),
    selected = reduction, selectize = FALSE, width = "100%"),
    selectInput(inputId = "xdim", label = "X dimension",
      choices = dims.reduc, selected = as.character(x = dims[1]),
      selectize = FALSE, width = "100%"), selectInput(inputId = "ydim",
      label = "Y dimension", choices = dims.reduc, selected = as.character(x = dims[2]),
      selectize = FALSE, width = "100%"), selectInput(inputId = "palette",
      label = "Color scheme", choices = names(x = FeaturePalettes),
      selected = "Seurat", selectize = FALSE, width = "100%"),
    width = "100%"), plotOutput(outputId = "plot", height = "100%"),
    flex = c(1, 4))))
  dims   plot.data     slot = slot)
  server function(input, output, session) {
    plot.env       dims), feature = feature, palette = "Seurat")
    observeEvent(eventExpr = input$done, handlerExpr = stopApp(returnValue = plot.env$plot))
    observe(x = {
      assay $assay
      feature.use $feature
      features.assay         slot = slot, assay = assay)))
      feature.use test = feature.use %in% features.assay,
        yes = feature.use, no = features.assay[1])
      reduc $reduction
      dims.reduc         replacement = "", x = colnames(x = object[[reduc]]))
      dims $xdim, input$ydim)
      for (i in seq_along(along.with = dims)) {
        if (!dims[i] %in% dims.reduc) {
          dims[i]         }
      }
      updateSelectInput(session = session, inputId = "xdim",
        label = "X dimension", choices = dims.reduc,
        selected = as.character(x = dims[1]))
      updateSelectInput(session = session, inputId = "ydim",
        label = "Y dimension", choices = dims.reduc,
        selected = as.character(x = dims[2]))
      updateSelectInput(session = session, inputId = "feature",
        label = feature.label, choices = features.assay,
        selected = feature.use)
    })
可以看出是用
miniUI
来实现的。miniUI提供了一个UI小部件,用于在R命令行中集成交互式应用程序。开发比较小的,或作为辅助功能的Shiny,miniUI是比较实用的,而且还支持多种展示形式,如下:
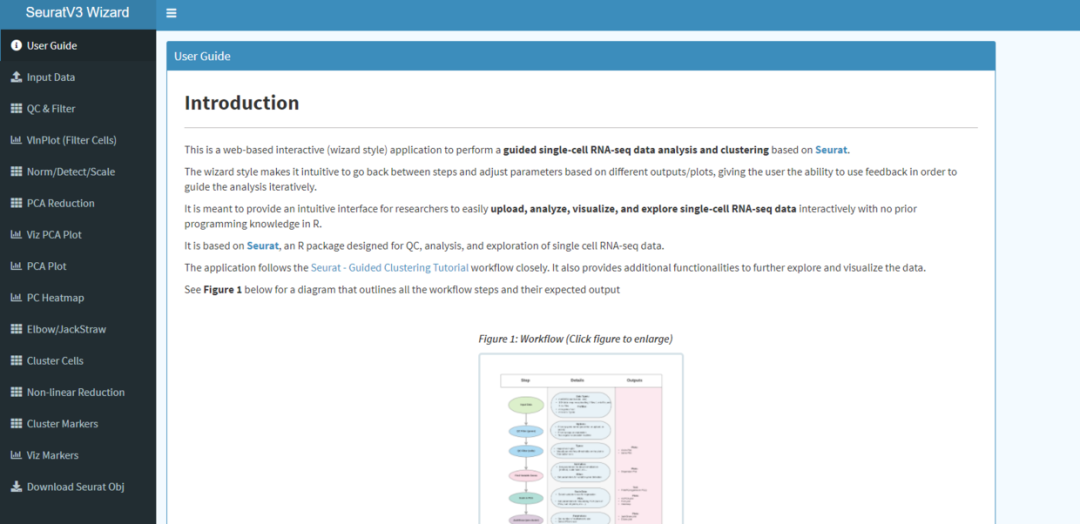
除了内置的交互形式之外,也有热心的Seurat开发了在线版的Seurat:SeuratV3Wizard,它旨在为研究人员提供一个直观的界面,让他们可以轻松地交互上传、分析、可视化和探索单细胞RNA-seq数据,而无需事先掌握R方面的编程知识。
地址:http://nasqar.abudhabi.nyu.edu/SeuratV3Wizard/
可以完成SeuratV3基本功能的线上分析,上传数据就可以直接点点点分析了,很方便:
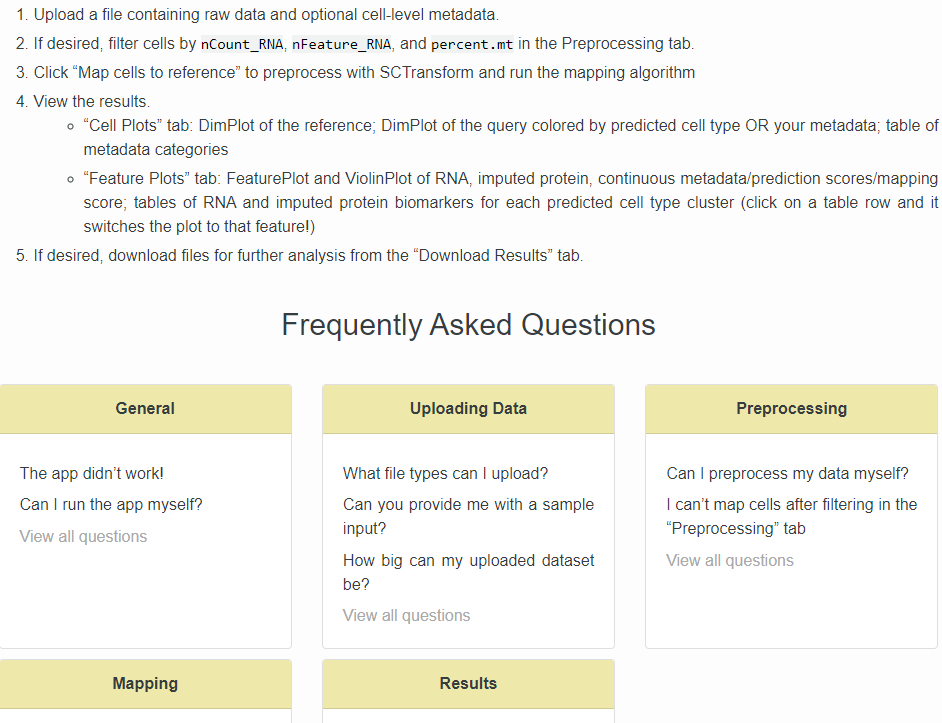
更上一层楼的是Seurat
V4 的azimuth
,不仅可以完成在线的基本分析还可以多PBMC做基于WNN的细胞类型注释,同时在效率上也得到了提升,可以一次性在线分析更多的细胞(小于100,000
cells , 基本可以满足一般的研究型图谱数据分析的要求)。风格很Seurat,有详细的教程和贴心的FAQ。
地址:https://satijalab.org/azimuth/

教程区:
除了直接在线分析也可以在自己的R中安装azimuth 包,以方便本地使用。


