
概要
市场成交量确认了去年10月和今年1月初的底部。
市场成交量与其趋势偏离的程度充分说明了市场的运行形态和方向。从历史上看,当成交量明显低于其趋势时,市场在随后几个月内触底反弹。反之亦然。去年9月出现的极低成交量其实已经确认了上证当时的2,450点为目前的重要底部。这个观察也和我们在2016年6月时,根据市场回报与五年计划中隐含增长目标之间的关系量化计算所得的底部一致。
但经济基本面继续疲弱,与市场价格显著背离。
虽然短期交易中基本面并不太重要,但市场价格不能永远脱离基本面。尽管货币和财政部门作出了巨大的努力,但工业品库存仍然保持高位,并且很快将在去库存时成为经济增长的拖累。基础设施投资计划表现出季节性的强势,但这早为人所知,因此也已经计入市场价格。房地产行业是一个信贷创造者,并具有强大的经济乘数效应,但这个行业仍然处于调控状态中。因此,中国经济正在触底,但尚未全面恢复生机。
保证金交易在总成交量中的占比接近其短期上限,市场飙升也将遇到阻力。
这个保证金交易的占比过去持续在一个明确而固定的范围内震荡。因此,它是衡量市场投机情绪的一个良好的指标。在当前融资交易飙升之后,这个指标已经接近其短期的上限。融资交易占比在这样的高度,将引起监管的干预。由于保证金交易一直是此轮牛市背后的推手,并且正在趋向短期的极限,市场飙升很快也将进入强大的阻力区间。最近剧烈的日间交易波动也从侧面证实了这一观察结果。
关注监管机构对保证金交易和房地产调控的态度。
我们暂时不会急于改变我们去年十一月对交易区间的估计,其最高端略高于2,900。在此水平附近,增加风险头寸的吸引力不如我们1月份在当前市场飙升前发布报告那时好。然而,如果保证金交易以2015年那样的风格卷土重来,而房地产调控基调放松,我们将再次见证投机狂潮 – 一如2015年一样。
这是我们20190228 的报告《
洪灝:融资牛路在何方
》的英文原版。感谢阅读。
---------------------------
Market turnover confirms bottom seen last October and early January.
How significantly market turnover deviates from its trends says a lot about where the market is at. Historically, when turnover is significantly below trend, market bottoms out in the ensuing months. And vice versa. The extremely low turnover seen last September confirms 2,450 in the Shanghai Composite as a significant bottom for now. It is also consistent with the bottom we quantified in June 2016, based on the relationship between market return and the implicit growth target in the Five-Year Plan.
But fundamentals continue to be weak, diverging significantly from price.
While fundamentals matter less in short-term trading, market price cannot deviate from fundamentals forever. Industrial goods inventory stays elevated, and will soon become a drag on growth once destocking starts, despite the best efforts by monetary and fiscal authorities. Infrastructure plans are seasonally strong, but are long known and in the price. The property sector, a credit creator with strong economic multiplier, is operating within regulator’s confines. As such, the economy is troughing, but has not yet been jolted back to life.
Percentage of total turnover in margin trades nearing short-term ceiling, and so is the market surge.
This percentage oscillated within a fixed range persistently in the past, and is a good gauge of market speculative sentiment. After the current rapid re-leveraging, this percentage is close to its short-term ceiling. And at these levels it will invite the regulatory intervention. As margin trades have been the fuel behind the bull run, and are hitting the limits, the market surge will likely be running into strong resistance. Recent volatile trading confirms this observation.
Watch regulator’s attitude towards margin trades and property.
We would not be so hasty to change our estimate of trading range with the top end of ~2,900 for now. Around these levels, it is less attractive to add risk positions than when we published our last report in January just before the current surge. That said, if margin trades come back in 2015 style, and property curbs are relaxed, we will be witnessing a speculative frenzy again - like 2015 once more.
M
ar
gin
Bull
Turnover confirms the market bottom last October
Shanghai has surged since the Gregorian New Year, and accelerated further after the Lunar New Year. Its performance has been staggering, leaving the rest of the world in the dust. But recently, the rally appears to be running into strong resistance.
There are concerns about the strong market turnover of over one trillion yuan a day, a scene reminiscent of the turbulent days in the summer of 2015 when the Chinese market bubble finally burst. Some pundits questioned who was on the other side of these trades and why. Concurrently, it is reported that industrial capital and some corporate insiders have been reducing their positions as the market surged.
Clarifying the motive behind the selling is a challenging inquiry. After all, these holders should have much lower entry prices, and the hefty gains YTD could have been enough to lure them out of some of their holdings.
In a public lecture given to industry participants organized by one of China’s most popular media domains last September, I postulated that the anchoring points of different market participants can be very different. While sellers tend to use the entry price upon which positions are built as the anchor, buyers, especially in a rising market, are obliged to look forward and speculate higher price points justified by current circumstances. Such differences in the anchoring points create an expectation gap, leading the market higher till the gap is closed.
Figure 1: Turnover bottom and reversal tend to indicate market turning points
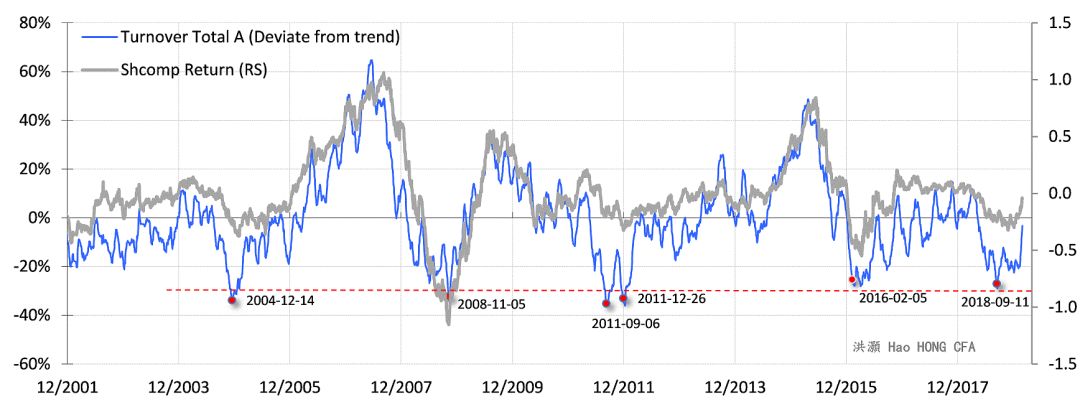
Source: Bloomberg, BOCOM Int'l
As such, trying to discern the market's peak and trough based purely on price movements can be fraught with biases. We are more curious about the record surging market turnover concurrent with the market recovery. Our quantitative analysis demonstrates that such record turnover indeed is rich in auspicious information about the future (
Figure 1
). For instance, we find that when turnover deviates significantly from its trends on the downside, such as in December 2004, November 2008 and February 2016, the market tends to bottom out in the ensuing months.
The last observation of such an occurrence was in September 2018, and the market bottomed out approximately one month later. Incidentally, our call of the Chinese bubble burst on 20150616 was also based on abnormally high turnover that was suggesting fervent speculative activities then, besides other developments (Please refer to
“The Great China Bubble: Lessons from 800 Years of History”
,
20150616). As such, from a technical perspective, the market had arrived at a significant low last October at ~2,450.
This conclusion drawn from turnover analysis is consistent with the conclusions from our other quantitative models (Please refer to
“
Turning a Corner”
, 20181119 and
“
Turning a Corner: Teachings from “the Dog”
”
, 20190201). It is also consistent with our calculation of the market bottom based on the relationship between Chinese market return and the implicit growth target embedded in the Five-Year Plan more than two years ago (Please refer to
“The Market Bottom: When and Where”
, 20160606). We have shared our findings with top government officials.
… But the economy will continue to struggle
Market participants are beset by the seeming contradiction between a surging stock market and weak earnings with blood-bath goodwill write-downs. While the market tends to bottom out before the economy, such glaring divergence between the so-called fundamentals and a surging market schematic begs the doubts – and rightly so.
A Chinese market wisecrack once says, “
If you care too much about the fundamentals, you have already fallen behind before the game even starts
”. There is an element of truth in it. But prices cannot deviate significantly from fundamentals too far for too long. If prices have jumped the gun, but fundamentals cannot catch up, then later on prices must come back to earth.
As such, it pays to investigate where the fundamentals are, after the market surge. Our analysis shows that industrial goods inventory level is still quite high. Indeed, the entire 2018 saw the inventory days of industrial goods remaining elevated at one of its highest levels in recent years. The inventory level of steel finished goods is particularly high. Historically, such persistently high inventory levels tend to suggest weak demand, and can be a drag on growth as destocking starts later (
Figure 2
). As such, the surging market has clearly left the fundamentals behind. And time is running out.
While the economic cycle is troughing, as we have discussed in our previous reports (
Figure 4-6
), it requires government initiatives to jolt it back to life. We have seen decisive monetary easing, as evidenced by the epic total social financing data and new lending data. The PBoC has been using some innovative monetary facilities, such as the TMLF, to try to resolve the structural issues in the Chinese monetary system.
But it is likely to take time. Banks are more willing to lend to large SOEs, because they are perceived to be less risky. And SMEs used to have to rely on shadow banking to an extent for financing. While the central bank is trying, banks’ risk appetite is sediment of Chinese commercial banking history, and is thus unlikely to change overnight. There have also been tax cuts amounted to hundreds of billions of yuan since late last year. But these policy relieves are likely to have been in the price.
Property investments, a credit generator with strong multiplier effect on the economy, remain weak. Meanwhile, infrastructure project approvals have surged, but probably a seasonal phenomenon. Also, the approvals tend to be front-loaded in the year to allow enough time for execution in the remainder of the year. As such, it remains to be seen how strong a recovery it could be in the current cycle, with the property sectors largely confined.
Figure 2: Industrial inventory destocking is set to begin, and will dampen growth and risk assets’ price
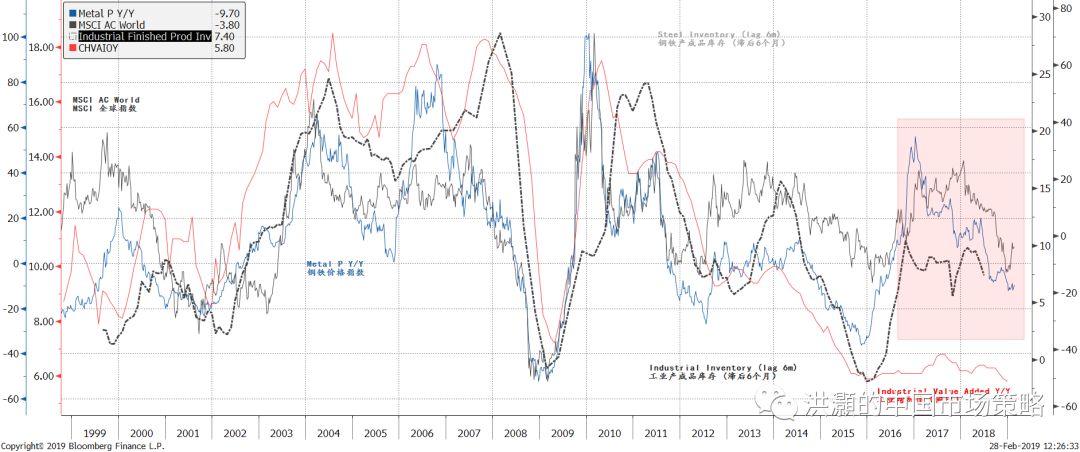
Source: Bloomberg, BOCOM Int'l
Margin trades are key to current bull market
If fundamentals have diverged from the surging market prices, and are likely to remain weak due to the constraints we discussed above, then the question begging to be asked is - is the current rally sustainable, and how much further could it go from here?
In our outlook report titled
“
Outlook 2019: Turning a Corner”
on 20181119, we discussed that 2019 will be the year when the Chinese economic cycle reaches its trough. We have also outlined a trading range of ~2,000 to ~2,900, with more than six months trading above 2,350, for the Shanghai Composite in part based on this outlook. The lower end of the trading range corresponds to a scenario where the trade disputes could not be resolved satisfactorily. We must emphasize that it is a risk scenario, not our base case. Now that the Shanghai Composite has risen to the upper end of our trading range, we must re-exam to see whether our trading range for the period till November 2019 still holds.
Our analysis shows that margin trades, as their importance in trading is rapidly increasing and has caught the attention, are indeed closely correlated with the trajectory of the Shanghai Composite. The composite’s important peaks and troughs, especially for periods shorter than six months, can be clearly identified by the tops and bottoms in the intensity of margin trading. That is, it is reasonable to conclude that these margin trades and the ups and downs in the Shanghai Composite are mutually reinforcing. The recent surge in the Shanghai Composite is clearly driven by the margin trades (
Figure 3
).
Figure 3: Margin trades drive Shanghai, and have bottomed out in late December
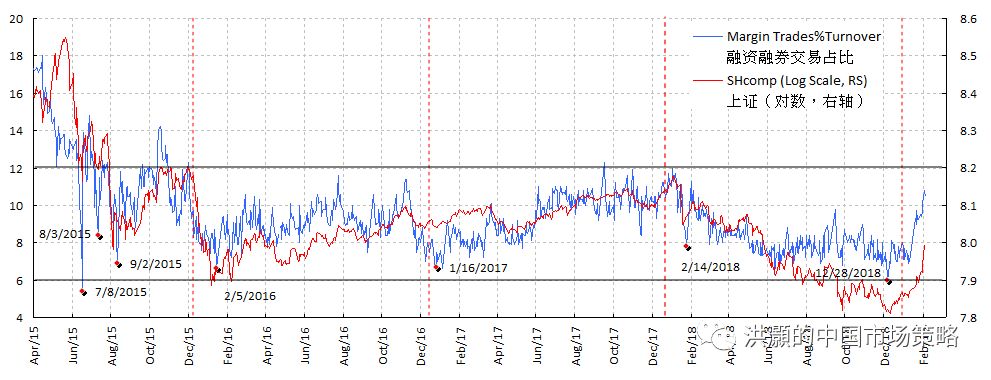
Source: Bloomberg, BOCOM Int'l
Further, we can see that since we have data for the margin trades, as a percentage of total market turnover it seems to be oscillating within a fixed range – between 6% and 12% of the total market turnover. If this range continues to hold, at the current 11% of the total market turnover, margin trades are likely to be very close to their short-term ceiling. No wonder the regulators have started to sound alarmed, as more margin trades are piling into the market.


