
概要
又一年的存量流动性博弈:
2018年还将是中国交易员面临流动性约束、进行存量博弈的一年。过去几年,表外业务的复杂性不断增加,以规避监管和资本充足率的要求。与此同时,表外杠杆不断累积。新出台的法规针对这些表外杠杆,
影子银行的增长受到限制。
如今,一些中小型银行的表外业务甚至已经达到了与表内相似的规模。
随着表外降杠杆,信贷增速也将减缓,市场利率中枢将保持高位,而一些与表外杠杆相对应的资产将被清算。这样的宏观环境很难很快地看到所谓的大牛市。
中国股市还将不温不火,并出现阶段性的波动:
在过去的几年里,我们的股债收益率模型在预测市场趋势时有出色的往绩。这个模型显示,在未来的12个月里上证的交易区间大约是在2800至3900之间,同时区间的中位数略高于3200 -- 类似于今年。此外,该模型还显示,2018年约一半以上的时间,上证仍将低于目前的3300点。我们的关键结论是:2018年市场仍将不温不火,同时因流动性条件变化,市场将不时出现短暂的波动。
小盘股的结构性行情:
在流动性的约束下,小盘股将会有结构性的机会。这是因为大盘股在2017年大幅上涨之后,它们的相对收益已经趋于极端。随着未来几个月通胀压力抬头,信贷增速放缓,债券收益率很可能在2018年一季度前仍难显著下行。相对于无风险的国债而言,大盘股虽盈利稳定,但估值却越来越高,并已开始失去明显的投资价值。从大盘股向小盘股轮动的过程将会是曲折的——直到这一趋势最终被大部分人认可为止。大盘股仍将有个别,而非系统性的机会。由于对增长和通胀反映的时滞,债券、股票和商品在2018年不同时段都各有“小熊”。
经济有序放缓:
短期看,中国的三年经济周期,以及同时运行的盈利、盈利预测和大宗商品的价格周期,都将继续放缓。这与近期晚周期行业(如原材料和能源)的潜在技术性轮动相一致,直到市场领涨的接力棒被传递到必需消费、医疗保健和公用事业等防御性行业为止。同时,在这个技术性轮动的过程中,晚周期行业的相对强势可能会被误读为新一轮的增长周期又开始了。(长期观点请看特别报告《
破译低通胀的密码:主要矛盾、社会进步和市场脆弱性
》)。
随着消费对经济增长的贡献不断增加,同时经济对房地产的依赖程度降低,中国经济放缓将很可能是有序的。最终,当前过于乐观的共识也将逐渐向增速放缓的现实收敛。自2015年末以来,中国的供给侧改革和房地产去库存的成功,无疑带动了当前全球经济的同步复苏。因此,中国经济有序放缓的影响将再次波及全球,尽管冲击的力度将比担心的要温和许多。
海外市场还有新高;明年一季度前后很可能是市场风格转变的时间点:
在中国有条不紊地去杠杆的同时,全球央行准备开始加息。目前,市场认为这是对当前周期强势的确认。尽管增长周期能否延续仍未盖棺定论,但除中国A股以外的海外主要股市的价格运行出现看涨的技术格局,暗示着未来海外主要市场还将出现新高。短期内,因交易情绪极端高涨,市场将面临下行风险。2018年第一季度之前的市场很可能与之后截然不同。在此之前和之后,市场的风格很可能南辕北辙。
这是今天的报告《
2018年展望:无限风光
》的英文原版《
Outlook 2018: View from the Peak
》,感谢阅读。
视频是11月21日盘前在彭博社与Rishaad Samalat、伦海迪关于资管行业监管新规的采访节选。
------------------------------
Summary
A year of liquidity constraints:
2018 will be another year of coping with liquidity constraints for the Chinese traders. Shadow banking growth is curtailed, and the new regulations are targeted at the stock of off-balance-sheet leverage that has been accumulating with increasing layers of complexity to evade regulatory supervision and capital requirements in the past few years. Some small/mid-sized banks’ off-balance-sheet asset size has grown to as big as that on balance sheet.
As off-balance-sheet deleveraging proceeds, credit growth will continue to decelerate, and market interest rates will stay elevated. Meanwhile, corresponding assets will have to be liquidated. As such, it is still difficult to see a raging bull market ahead.
Shanghai tepid, with bouts of volatility:
Indeed, our EYBY model, with an excellent track record of forecasting the general market trends for the past few years, suggests a likely trading range for the Shanghai Composite for the next twelve months to be between 2,800 and 3,900, with a median level of just above 3,200 – similar to the trading range in 2017. Further, our model suggests that roughly more than half of the time in 2018 the composite will be trading at below its current level of ~3,300. In short, the market will be tepid in 2018, with bouts of brief volatility surges due to changes in liquidity conditions.
Structural opportunities in small caps:
Given the liquidity constraints, structural opportunities in small caps will emerge. Large caps have run hard in 2017, and their relative outperformance is approaching extreme. As inflation pressure builds in the coming months and credit growth weakens, bonds will stay cheap till around 1Q2018. Large caps, with their steady bond-like earnings but increasingly expensive valuation, have started to lose its appeal, especially relative to bonds.
The rotation from large caps back to small caps will zigzag - before the trend becomes apparent for most. Some large caps will continue to perform, but the strength will unlikely to be ubiquitous. With the time lag in reflecting the changes in growth and inflation, bonds, stocks and commodities will each see “small bears” at various stages during 2018.
A measured slowdown:
In the near term, China’s three-year economic cycle, as well as the concurrent cycles in earnings, estimates and commodities, will continue to weaken. This is consistent with a potential technical rotation into some late-cycle cyclical sectors such as materials and energy in the near term, before the baton of market leadership will be passed onto defensive sectors such as staples, healthcare and utilities. And the strength in the late-cycle sectors during the technical rotation can make many misconstrue that growth is reborn.
With the economic growth less reliant on property but more on consumption, the slowdown will likely be measured, with bullish consensus gradually coming to terms with reality. China’s supply-side reform and property de-stocking have unambiguously contributed to the subsequent global upswing since late 2015. The turn for lower in China’s economic cycle will once again be felt by the world, albeit more benign than feared. (For long term views, please see our recent special report “
Decoding Disinflation: Principal Contradiction, Social Progress and Market Fragility
” on November 14, 2017)
New highs outside mainland China; potential dichotomy of market before and after 1Q2018:
As China deleverages delicately, global central banks appear ready to hike rates. For now, the market considers this a confirmation of the strength in the current cycle. While the jury is still out, the bullish technical setup in global markets outside Shanghai hints at further new highs ahead. Near term, market sentiment is extremely buoyant, and is susceptible to downside volatility. The market before the first quarter of 2018 can be very different from the rest of the year. There is likely to be a dichotomy in market performance before and after.
------------------------------
“We want to do business in such an (pessimistic) environment, not because we like pessimism but because we like the prices it produces. It’s optimism that is the enemy of the rational buyer.” – Warren Buffett
China’s Shadow Banking Growth Curtailed.
China’s interest rate surge induces cross-asset volatility.
Just as the world is contented with widely-suppressed volatility, the Chinese bond market and commodity futures are roiled with epic volatility. Chinese stocks have also taken a hit, with China’s beloved “Nifty-Fifty” stocks suffering the worst single-day plunge in more than a year. In recent years, such changes in volatility regime tend to occur whenever the funding costs in the country’s financial industry surge, induced by regulatory changes.
And Chinese financial market volatility tends to lead that of the global markets by up to one year, just as it presaged the volatility surge spurred by Brexit in June 2016 - one year after the 2015 bubble burst (please see our report “
The Great China Bubble: Anniversary Lessons and Outlook
” on June 15, 2016).
Exhibit 1: Funding costs surging after new regulation proposed for the asset management industry
 Source: Bloomberg, BOCOM Int’l
The liquidity crisis in June 2013 was induced by tightening regulations regarding non-standard credit assets (NCAs hereafter; please see our report just before the liquidity crisis “
Auguries of Turbulence
” on June 10, 2013). The surge in funding costs during the stock bubble collapse in June 2015 was spurred by the deleveraging policies targeted at margin loans, umbrella trusts and stock index futures (please see our report prior to the collapse “
The Great China Bubble: Lessons from 800 Years of History
” on June 16, 2015).
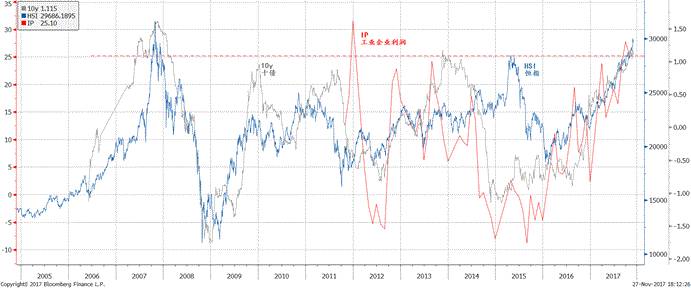
Besides funding shortage induced by tightening regulation, the PetroChina IPO frenzy in October 2007 drained RMB3.3tn of liquidity through IPO deposits. And the downgrade of US sovereign rating in August 2011 triggered interest rate soaring simultaneously across the world (
Exhibit 1
). And the Chinese interest rates were not spared.
Curbs on China’s shadow banks is balance-sheet deleverage
. Since late 2016 when the macro prudential assessment (MPA) framework was first proposed, funding costs across the board began to rise, as evidenced in the rises in both levels and volatility across key benchmark interest rates such as DR07, RP07, as well as the yields of corporate bonds, government bonds and CDB bonds. During the recent surge, the CDB bond yield has for the first time surpassed the benchmark lending rate, suggesting some financial institutions funding costs have in nominal terms exceeded their interest income (
Exhibit 1
).
The various episodes of interest rate surge represent the authorities’ efforts to regulate banks’ activities off-balance-sheet. After all, there are tight restrictions on capital reserve requirements and various ratio requirements to meet for banks to lend. But each time, banks, especially smaller ones, have managed to skirt the regulations by increasing layers of complexity, by such means as wealth management products (WMPs), interbank certificate of deposits, passageway investments and entrusted investments. These structures hide off-balance-sheet leverage further and further away from the authorities.
In an effort to stabilize the market after the bubble burst in 2015, the PBoC managed to keep market interest rates steady. While stock market volatility finally subsided, low and stable interest rates have been conducive to adding leverage (
Exhibit 1
). Consequently, for some small/medium-sized banks, the off-balance-sheet items have grown to just as big as those on balance sheet, and increasingly represent systemic risks and regulatory challenges.
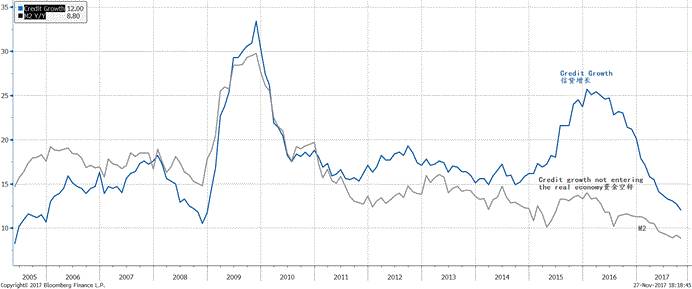
Exhibit 2: Domestic credit growth slowing, converging with M2; Shadow banking is curbed
 Source: Bloomberg, BOCOM Int’l
As regulations tighten on shadow banks, China’s credit growth has plunged and started to converge with M2 growth since 2016. Such developments suggest the growth in the size of shadow banks has been curtailed (
Exhibit 2
). The new regulations are now targeting the stock of off-balance-sheet credits.
As credit growth slows, its drag on economic growth will gradually emerge, as suggested by recent softening economic data. And the reduction in off-balance-sheet leverage will inevitably induce forced sales of some of the corresponding underlying assets, pressuring both bond and equity prices. The recent epic surge in bond yields offers a glimpse of what looms. We have until June 2019 to clean up. The effects of tightening regulations will be more apparent in the coming 18 months.
Rotation from Large to Small Caps
Large has outperformed small in 2017.
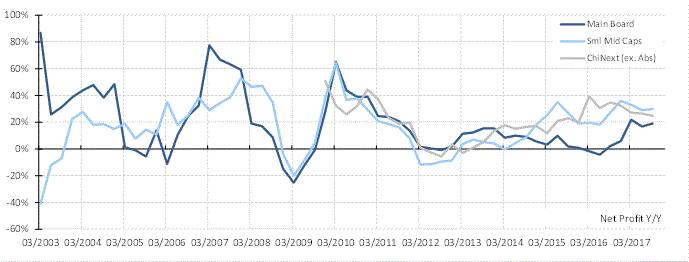
One of our key calls throughout 2017 has been buying large caps while avoiding smaller caps. Our logic is that during the mid- to late-stage economic expansion, large caps tend to outperform, as they have steady earnings growth and more reasonable valuation relative to small caps. Indeed, the earnings growth of large caps on the main board has recovered faster than that of small caps and the ChiNext, mostly driven by the strength in large upstream commodity producers (
Exhibit 3
).
This call has worked well in 2017, with large caps outperforming small caps in China, Hong Kong and in the US. And the HSI and HSCEI, dominated by large caps, are among the best-performing major stock indices globally.
Exhibit 3: Earnings recovery on the main board has been faster than that of small/mid caps and ChiNext. But the relative improvement has started to stall.
 Source: Bloomberg, BOCOM Int’l
Large caps’ relative return is approaching extreme.
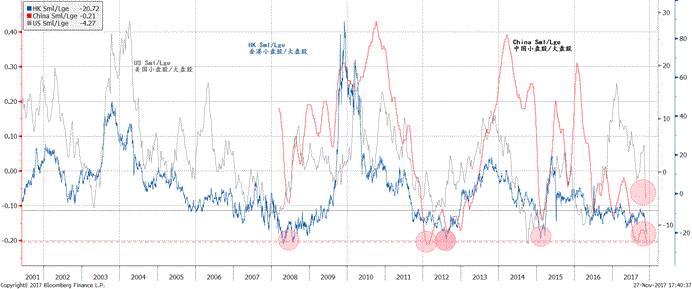
As large has been beating small throughout 2017 globally, large caps’ relative strength is now stretched into extremes in China and Hong Kong, while rapidly approaching extreme in the US market. Small caps’ relative underperformance in China is similar to the level that initiated the bull market in small caps in 2012 (
Exhibit 4
).
Exhibit 4: Large caps’ relative outperformance reaching extreme globally; small caps set to bounce
Source: Bloomberg, Federal Reserve, BLS, BEA, BOCOM Int’l
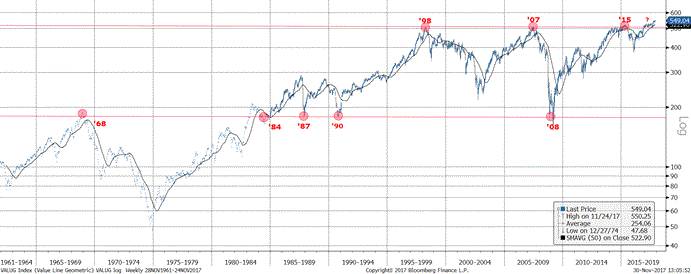
Meanwhile, the index of an equal-weighted portfolio in the US is breaking into new highs for over five decades. Such a phenomenon suggests that smaller caps have started to perform (
Exhibit 5
). Together with the large caps, they are propelling the US indices to new highs.
While recent US economic releases have been strong, it is bewildering such broad-based market strength is emerging at a late stage of economic expansion. Besides the current strength in the US economy, the market appears to be very optimistic on Trump’s tax reform. If such price momentum persists, it will push markets even further to new highs.
Exhibit 5: Equal-weighted broad market index breaks new high, suggesting strengthening small caps
 Source: Bloomberg, BOCOM Int’l
Late Cycle and Technical Cyclical Rotation
Technical cyclical rotation is set to begin.
Meanwhile, our cyclical defensive sector rotation model is showing defensive sectors have been outperforming cyclicals recently. The magnitude of defensive sectors’ relative performance suggests a technical sector rotation from defensive to cyclical ones in the short term. And the current underperformance of the cyclicals suggests caution near term (
Exhibit 6
).
Exhibit 6: Growth moves into late cycle; Late cyclicals, such as energy and materials, set to outperform
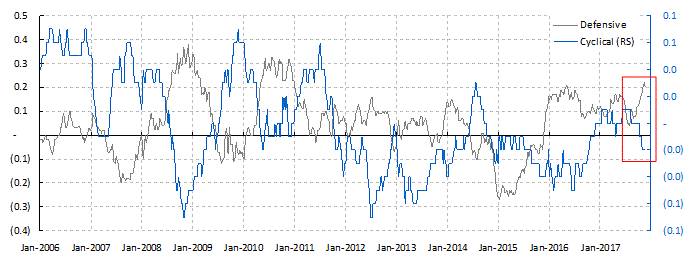
Source: Bloomberg, BOCOM Int’l
Note: Cyclicals are equal-weighted industrials, materials, energy, consumer discretionary and financials; Defensives are healthcare, utilities and consumer staples
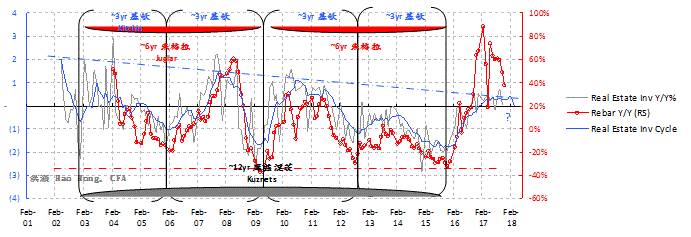
China’s three-year economic cycle is waning.
In our report titled “
A Definitive Guide to China’s Economic Cycles
” (
I
and
II
, on March 24 and August 28, 2017), we demonstrated the relatively regular three-year cycle inherent in China’s economy. This economic cycle is driven by the property inventory investment cycle, which tends to take three years from land auction to completion for delivery.
This cycle is consistent with the Kitchin inventory cycle – the shortest variation of economic cycles. We then applied this three-year cycle to explain the variance in basically all key Chinese economic variables, such as economic growth, money supply, bond and commodity prices and stock markets, etc. We demonstrated that all these key variables show three-year cyclicality consistent with our theory of China’s economic cycle.
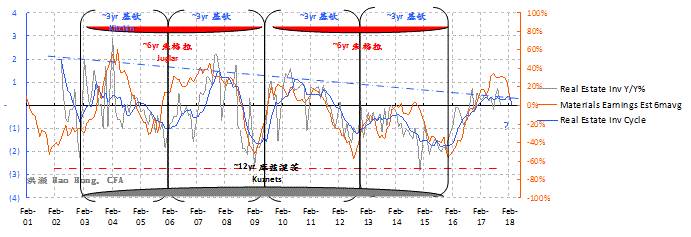
Exhibit 7: The earning cycle is waning, so are earnings estimates
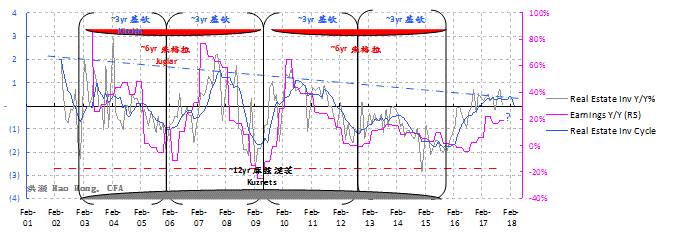
Source: Bloomberg, Factset, NBS, BOCOM Int’l
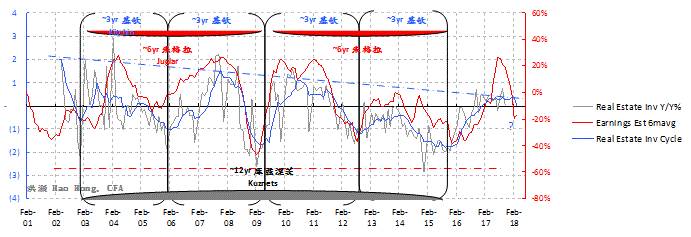
The concurrent three-year cycle in earnings and earnings estimates is turning, too.
In this report, we again apply our three-year cycle to Chinese market’s earnings growth, changes in earnings estimates, the earnings estimates of materials and the price of rebar. Unsurprisingly, we find regular three-year cyclicality in these important economic variables. More importantly, our economic cycle model shows that the momentum in all these variables has turned, and is about to wane (
Exhibits 7
and
8
).
Exhibit 8: Materials earnings growth and rebar price momentum are waning
 Source: Bloomberg, NBS, BOCOM Int’l
That is, the Chinese economy is at its late stage of expansion, and growth is about to moderate. Depending on the conditions of credit growth, the growth deceleration can be more severe than expected. But the deceleration can also be more benign than feared, as now China’s economy is less reliant on the property sector, and consumption has contributed more than half of the country’s GDP growth in recent quarters.
Recent economic releases are showing sequentially-weaker money supply and credit growth, property investment growth and industrial profit growth, among the others (
Exhibit 9
). And the fading momentum in the current economic cycle will likely become more apparent in the coming months. So far, it has been an orderly slowdown.
Exhibit 9: China’s industrial profit growth will soon wane, as the economic cycle slows
Source: Bloomberg, BOCOM Int’l
Late cyclicals’ strength is likely to be brief.
Given the looming change of gears in economic growth, although a technical rotation from defensive names to cyclicals is likely in the near term, such rotation will likely be transient. More importantly, the underperformance of cyclicals indeed is hinting at near-term market vulnerability (
Exhibit 6
), which is unfolding as we write. The potential technical strength in cyclicals is coming from late cyclicals such as energy and materials, consistent with the observation of late-stage expansion.
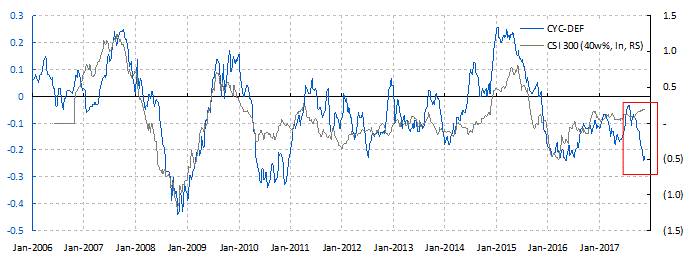
If so, defensive sectors such as utilities, healthcare and consumer staples will likely outperform, after the technical strength in late cyclicals exhausts – probably during the first quarter of 2018. The decelerating Chinese property investment cycle aforementioned, and our cycle of investment return in the US that historically correlated with cyclicals’ relative performance (
Exhibit 10
), are also hinting that late cyclical strength is likely to be brief.
Exhibit 10: The US history of investment return also suggests that strength in late cyclicals won’t last.
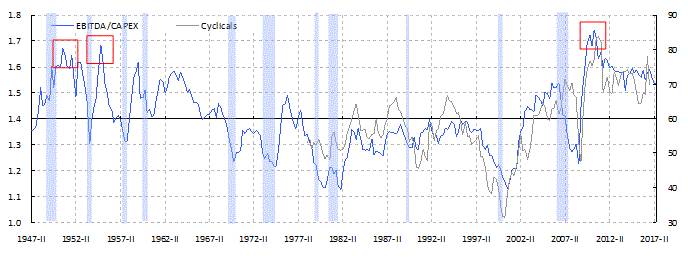 Source: Bloomberg, Federal Reserve, BLS, BEA, BOCOM Int’l
Note: Blue-shaded areas are US recessionary periods.
Monetary Policy Outlook
The ten-year yield is a history of surplus value exploitation.
In our special report titled “
A Price Revolution: On Global Asset Allocation
” on November14, 2016, we postulated that inadequate labor compensation relative to productivity gain, or the exploitation of labor’s surplus value, has been depressing inflation and hence bond yield for over three decades (
Exhibit 11


