In recent decades, declining trade barriers and advances in information and communication technologies have induced firms to source inputs more globally. Indeed, recent research shows a declining share of domestic content in countries’ aggregate exports, despite rising trade volume (e.g., Koopman, Wang, and Wei, 2014; Johnson and Noguera, 2016). The iPhone, which bears an engraving that says “designed by Apple in California. Assembled in China,” best exemplifies this trend. However, the iPhone’s marking only reveals the first and final steps of a long and complex production process. Over a hundred suppliers from around the world produce its various components and export them to China for final assembly. The bulk of the revenues from the iPhone’s retail sales are paid to Apple and several key multinational firms that provide its most essential inputs. Only 1.8 percent of the iPhone’s price is used to pay the wage bill of Chinese assembly workers (Kraemer, Linden, and Dedrick, 2011).
How representative is the Apple example of China’s segment of global value chains? Do Chinese firms and workers still heavily rely on imported inputs while contributing little to the country’s exports?
In our recent article published in American Economic Review (Kee and Tang, 2016), we find that China defies global trends and experiences an increasing level of domestic content in its exports since its accession to the World Trade Organization in late 2001. Using comprehensive manufacturing firm and customs transaction-level data, we systematically explore the domestic segment of global value chains in China from 2000 to 2007. We find that the share of domestic content in Chinese exports — or the ratio of domestic value added in exports to gross exports (DVAR) — has steadily increased from 65 percent in 2000 to 70 percent in 2007 (see
Figure 1
). The ascent of China’s processing sector is even steeper — from 46 percent in 2000 to 55 percent in 2007 (see
Figure 2
).
Figure 3
highlights the upward trend for most industries, including the machinery, mechanical, and electrical equipment sector — which comprises Foxconn, the company that completed the final stage of the production of Apple products.
Figure 1: DVAR of Aggregate Exports (2000-2007)
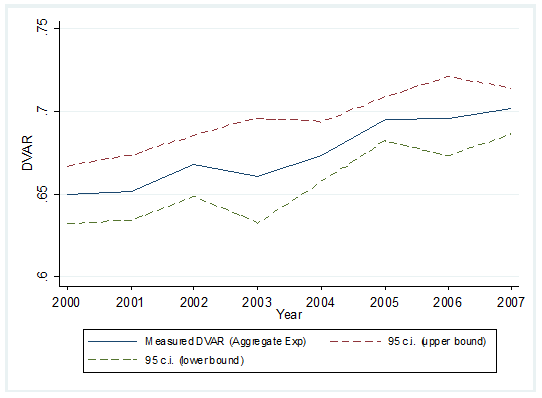 Source: Kee and Tang (2016)
Figure 2: DVAR of Processing Exports (2000-2007)
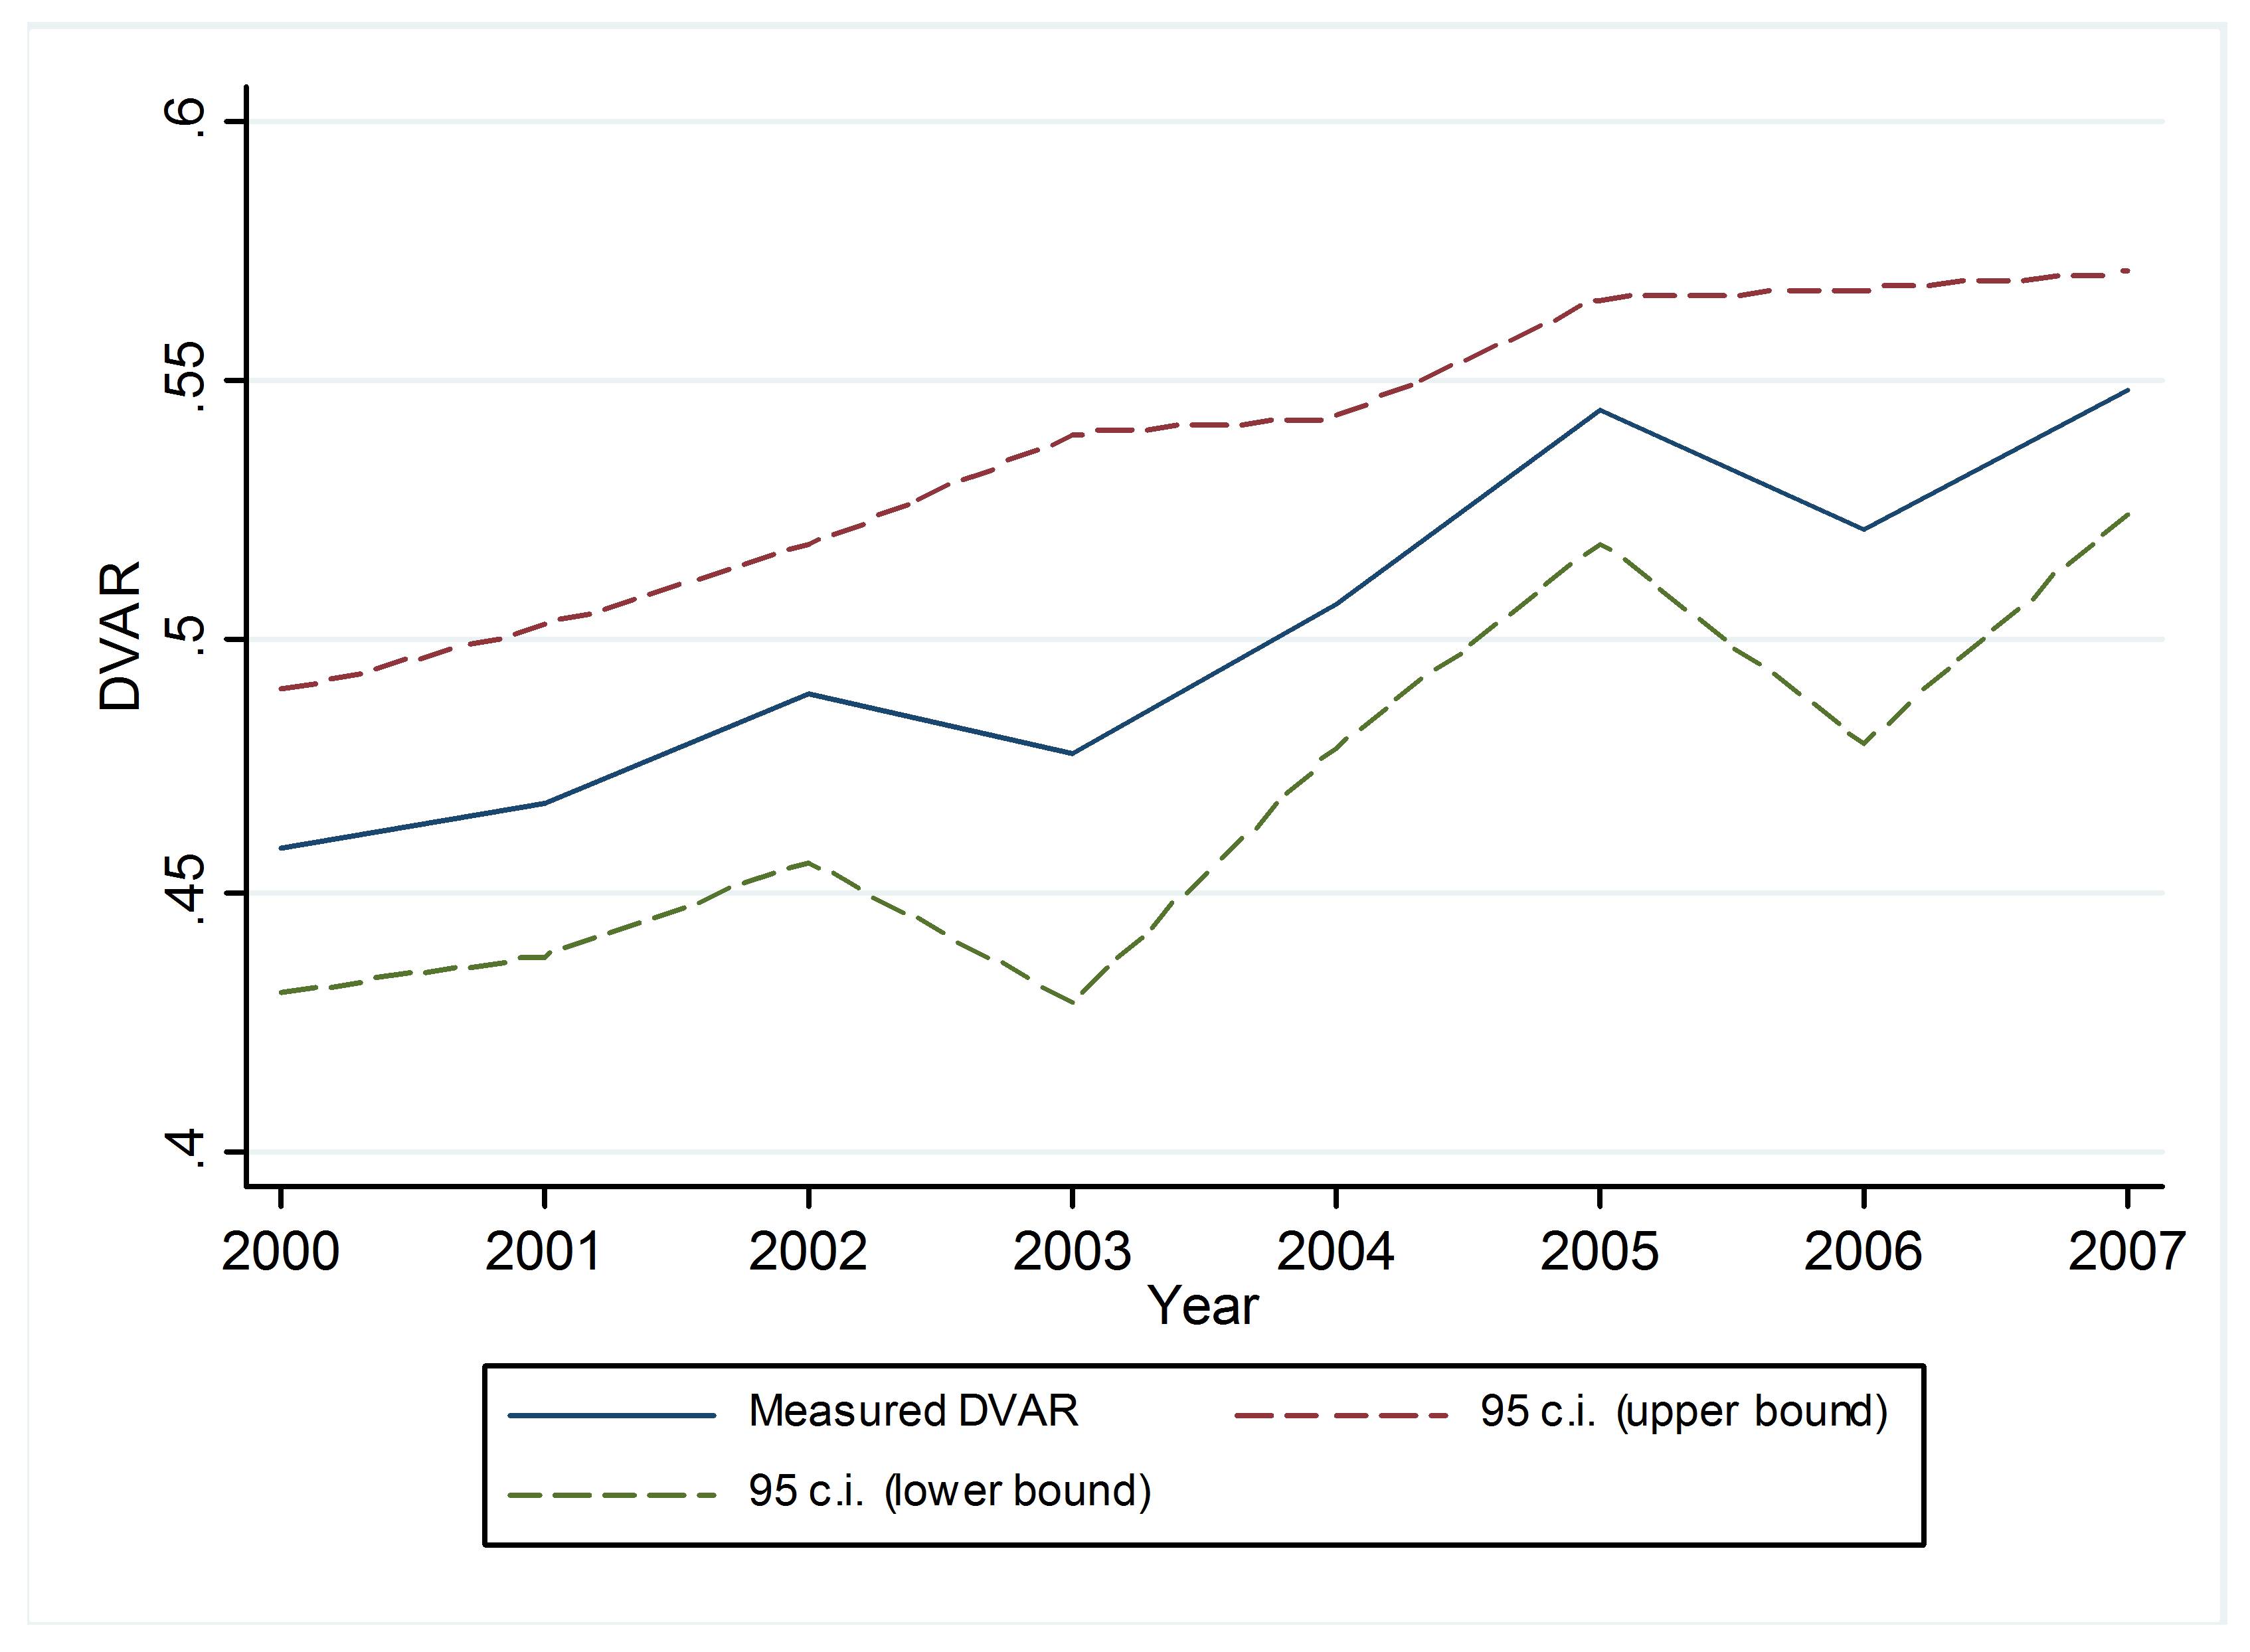 Source: Kee and Tang (2016)
Figure 3: DVAR Trend (2000-2007) by Industry
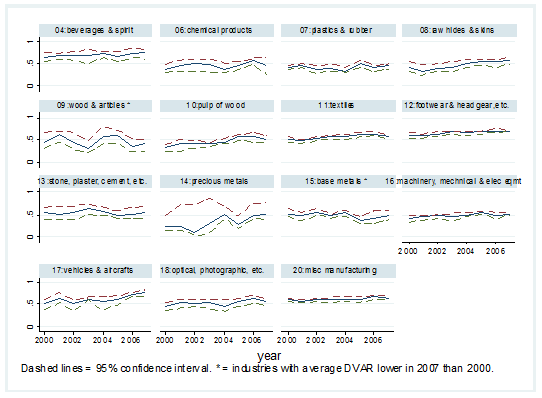 Source: Kee and Tang (2016)
What caused China to upend the global trend of declining domestic content in exports despite its increasing participation in global value chains? There are several possibilities. The phenomenon could be due to China’s shifting its comparative advantage from low value-added industries to high value-added industries. It could also be a result of its increasing domestic production costs. Another possibility is that firms in China may have gradually shifted their sourcing of intermediate inputs from foreign to domestic suppliers.
Our empirical evidence supports the third possibility; namely, that China’s growing domestic content in exports is due to its exporting firms gradually replacing imported inputs with domestic products. We develop a model that pins down a structural relationship between the prices of domestic materials relative to foreign materials and firms’ DVAR. We then construct the relative price index of domestic inputs using our micro data and use a 3SLS model to empirically examine how China’s tariff and foreign direct investment (FDI) liberalizations affect exporters’ DVAR. We find that the DVAR is affected through changing domestic input varieties and hence the relative prices of domestic materials.
Our regression results show that exporting firms’ substitution of foreign inputs with domestic inputs is induced by both liberalizations in the early 2000s. Existing studies show that FDI can increase the demand for domestic materials, thus raising the supply and quality of domestic input varieties from the upstream industries due to the scale effect (Kee, 2015). Tariff liberalization, on the other hand, gives domestic suppliers access to newer, cheaper, or better imported inputs, which lowers their production costs both directly and indirectly due to endogenous improvement in productivity (Goldberg et al., 2010). As a result, external liberalization encourages China’s intermediate input producers to expand product variety, therefore lowering domestic input prices and inducing individual processing exporters to substitute domestic for imported materials.
Other factors, such as rising wages and capital costs in China, the changing composition of exports towards high value-added industries, the potential decrease in the prevalence of processing trade, or firm entry and exit, cannot explain the upward trend over the period of analysis. In other words, the phenomenon of China’s “moving up the value chain” takes place within firms.
Methodologically, our granular approach differs from the common approach adopted in the existing literature on the measurement of the DVAR of exports, which relies on figures drawn from countries’ input-output (IO) tables. Our approach takes firm heterogeneity into account in order to reduce aggregation bias. In fact, we empirically show that ignoring firm heterogeneity in the IO table-based approach may lead to downward biased estimates of the aggregate DVAR. This is due to the fact that in the construction of IO tables, large firms tend to be oversampled. Given that larger firms tend to import relatively more goods and therefore have lower DVAR (Amiti, Itskhoki, and Konings, 2014), the IO table-based approach yields lower estimates of the aggregate DVAR.


