Summary - Risk appetite is running high, yet big caps are outperforming instead of small caps. And cyclical assets such as commodities and US financials have corrected significantly. It is perplexing. The new financial regulation in China alone cannot explain this global phenomenon. The market is increasingly challenging, as big caps are becoming crowded, while smaller caps are fraught with risks.
Our research shows that big caps tend to outperform amid moderating growth, as it is now. Ubiquitous expectation drove US funds into the Nifty-Fifty back in the 1970’s for growth, while now herding Chinese funds into A50 for risk sheltering. Besides earnings stability, visibility and industry dominance in an increasingly unpredictable environment, the A50 is also seen as a convenient instrument for market stabilization ops. As such, owning these big cap names indeed aligns one’s interest with higher market power.
But ubiquity also breeds extremism. Big caps’ relative return is approaching extreme, hinting at a technical rebound in small caps with lower highs – an opportunity to reduce positions. With growth in the US and China sets to moderate in the coming months, big caps will continue to outperform, and commodity’s bear market rally will continue to test traders’ skills. When buying, size is key. Yield curve will continue to flatten, and credit spread will widen further. Current elated sentiment in Hong Kong augurs for new highs ahead, and the final dash could be spectacular enough to make the early bears cry – till the winter sets in.
这是今天的报告《下半年展望:要命的不漂亮,漂亮的不要命》的英文版,感谢阅读。
----------
Market risk is rising.
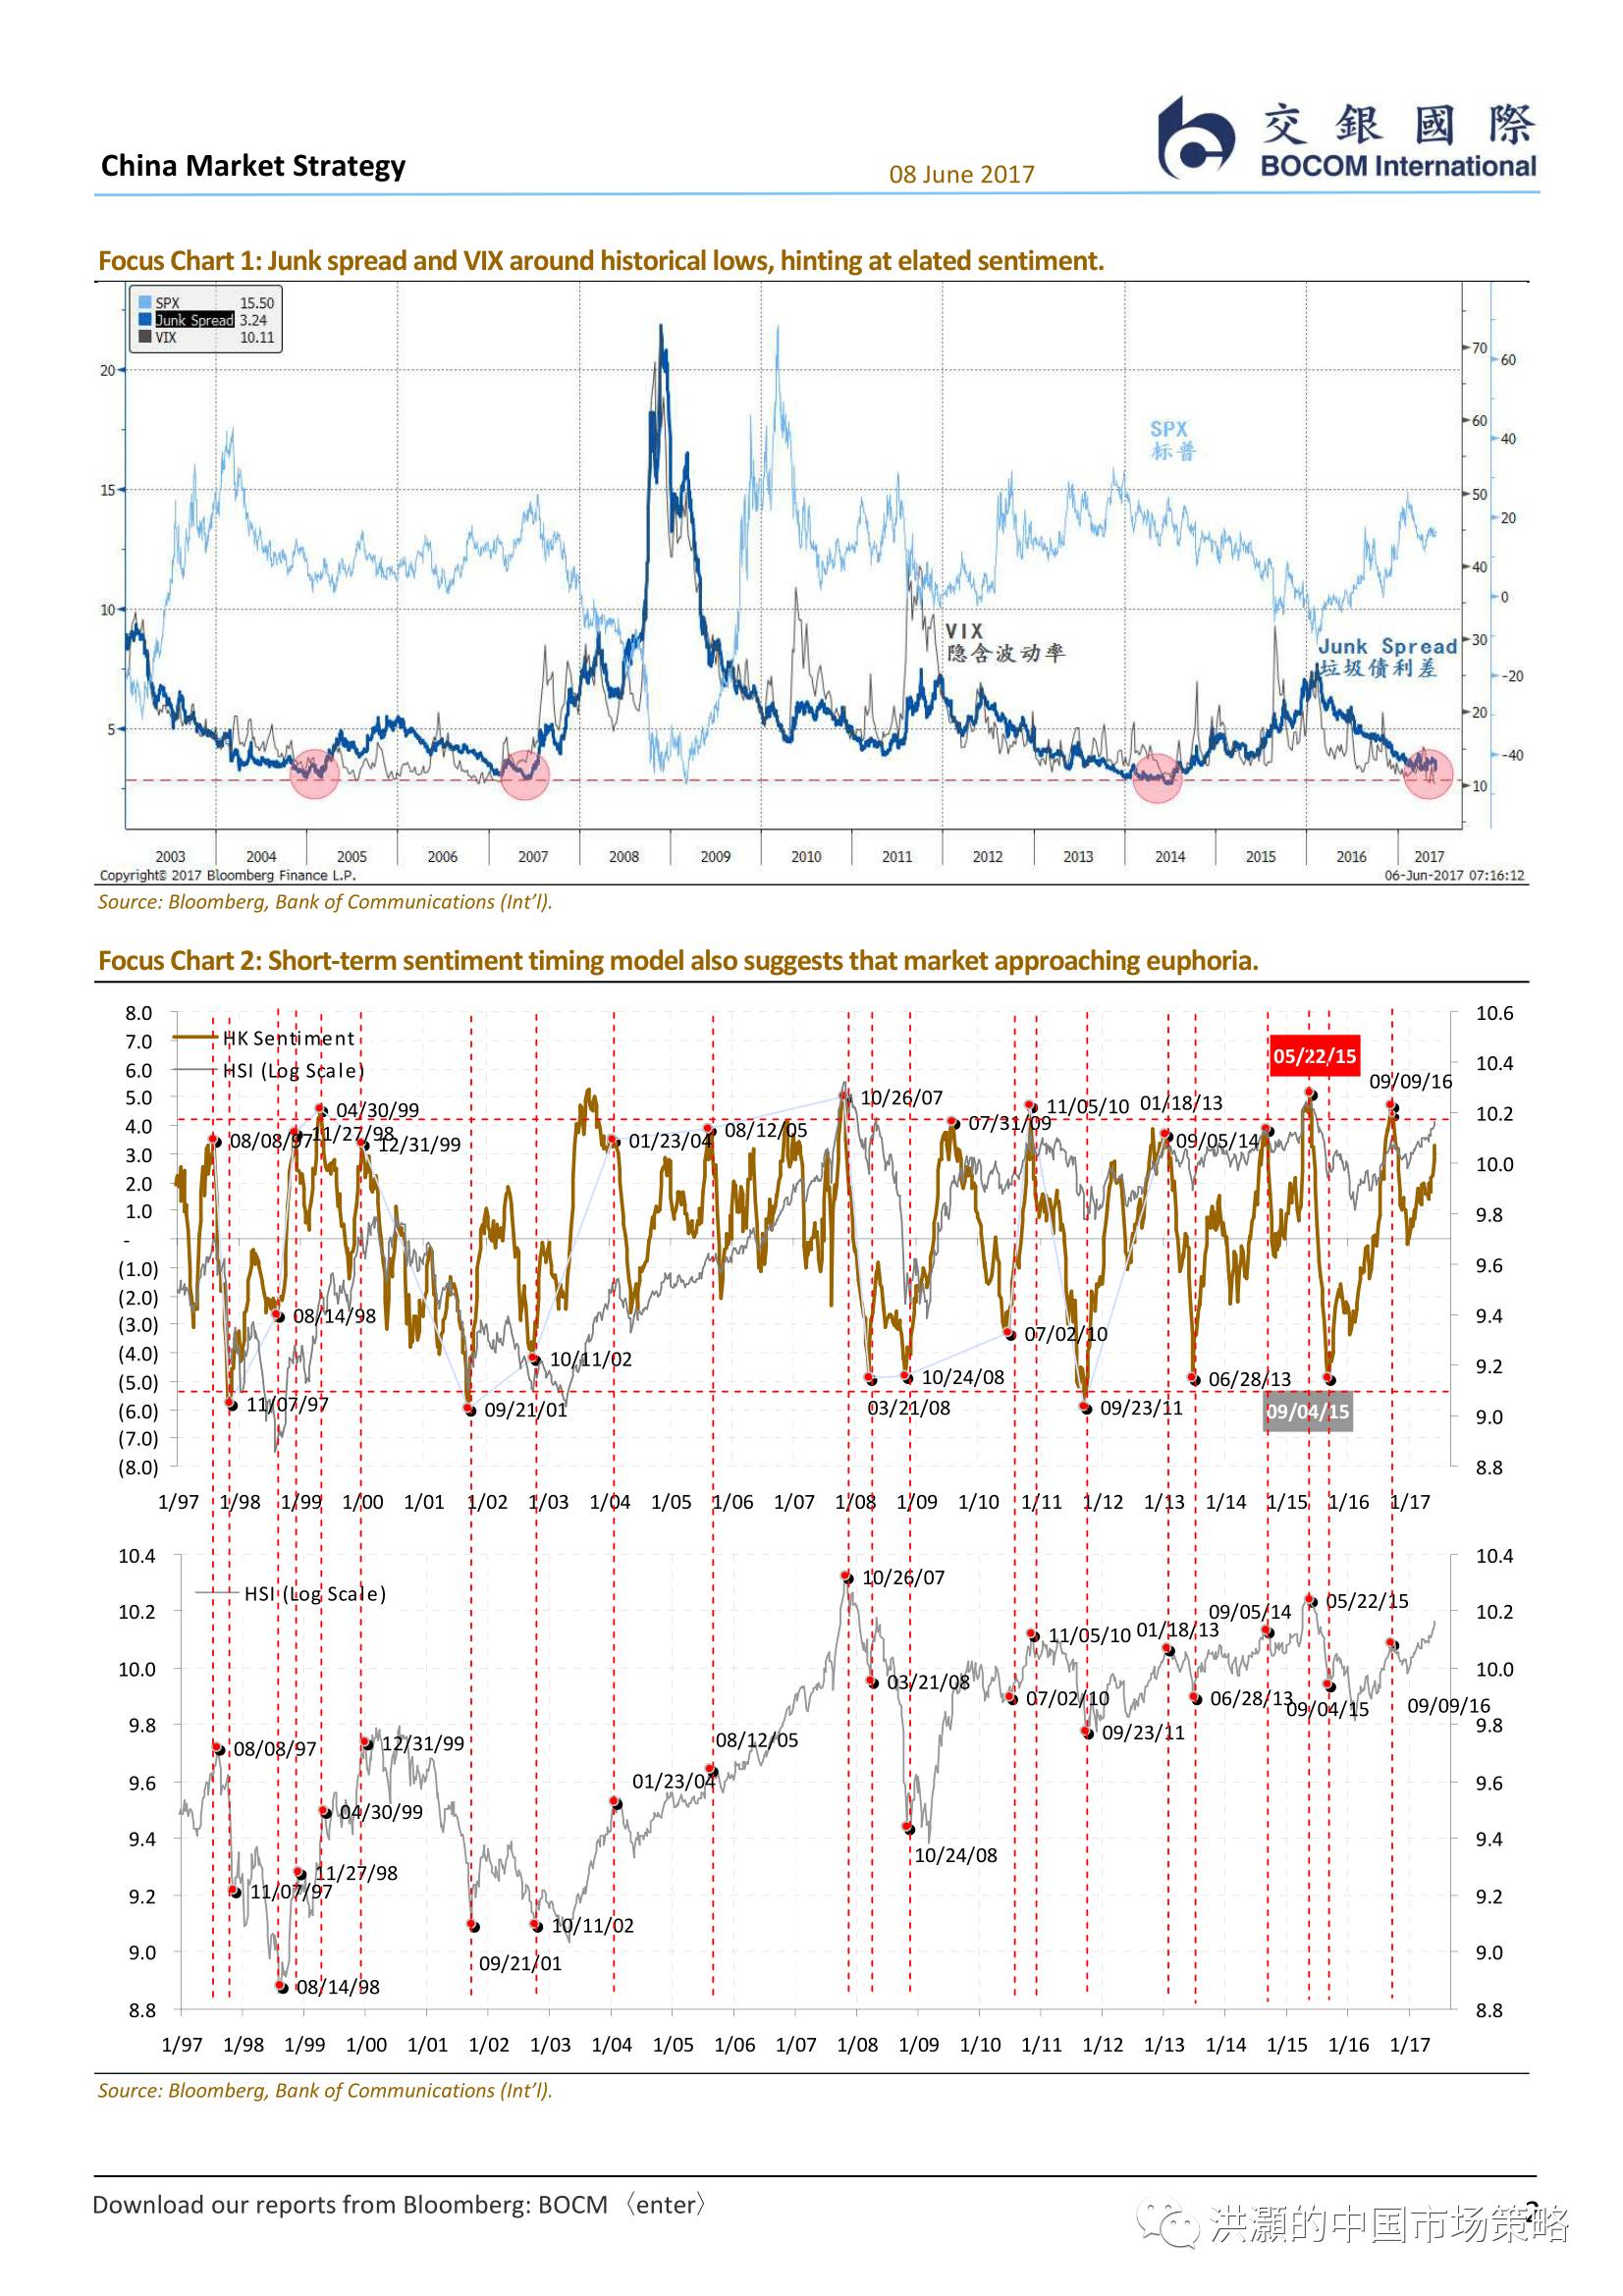
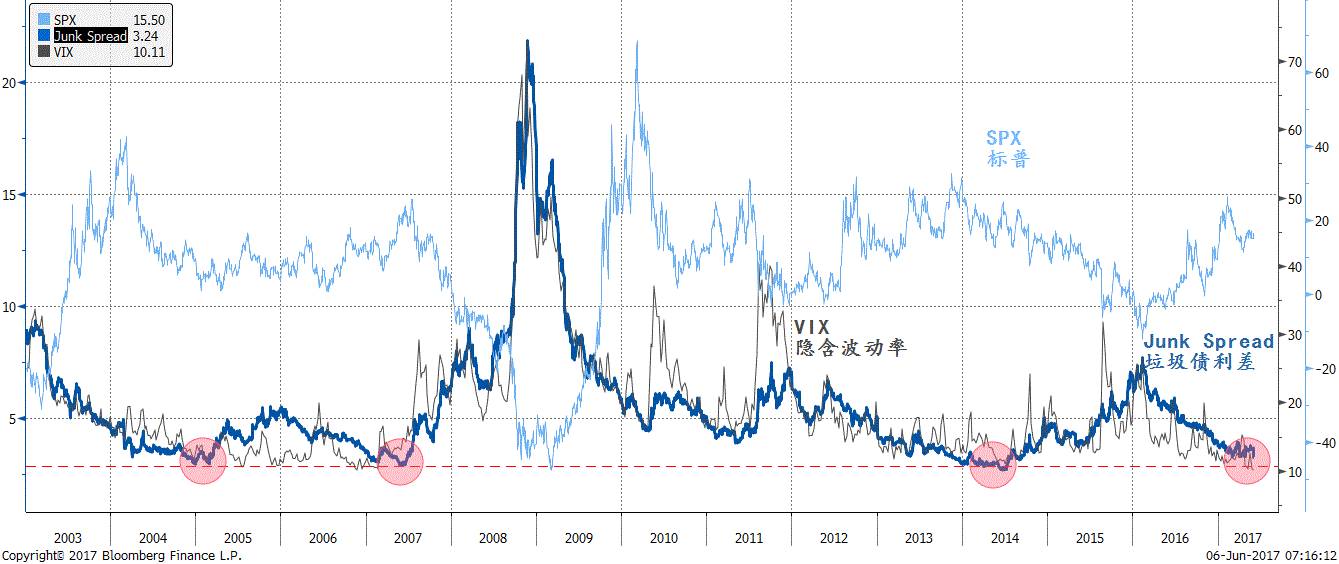
Market risk is rising. Junk bond spread and VIX are approaching their historical lows, which at times coincided with market crises in the past (Focus Chart 1). While by themselves they are warning signs hinting at excessive market risk taking, the historical lows observed in these market prices did not immediately portend bearish market development in 2005. They are capable of staying at low levels for some time, preceding a tranquil period for markets to move higher – before the systematic risks unravel, as in the second half of 2007, as well as in the summer of 2015.
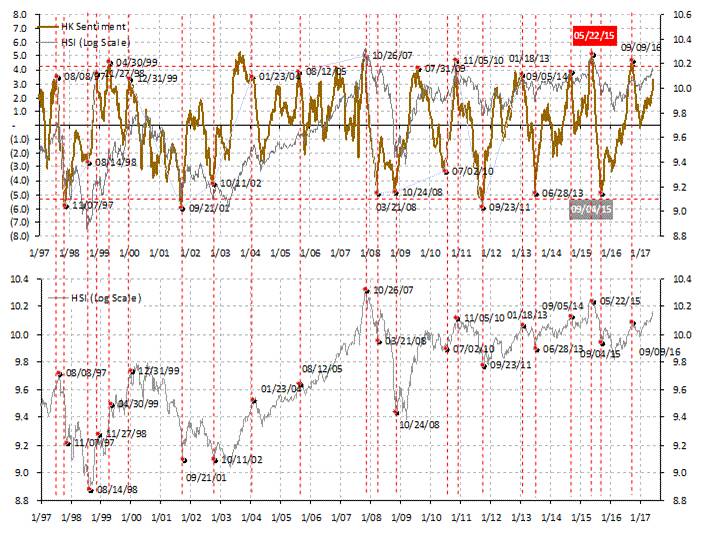
Meanwhile, we find that the market risk premium in Hong Kong is also falling towards historical lows that have been consistent with the LatAm Crisis in 1994, the Asian Crisis in 1997, the Millennium Bubble and the 2008 Global Financial Crisis. (Please see our report titled “Re-pricing Risks under New Regulations” on May 24, 2017.) Our short-term sentiment timing model is elevated, too. Our models have strong track records, and have helped us negotiate the torrents during China’s market bubble burst in 2015 (Focus Chart 2). Together, these observations suggest that market risk is rising, and should be monitored closely by traders.
Focus Chart 1: Junk spread and VIX around historical lows, hinting at elated sentiment.
Focus Chart 2: Short-term sentiment timing model also suggests that market approaching euphoria.
The St. Petersburg Paradox and the Nifty-Fifty
China’s A50 index, consisting of mostly big caps, has significantly outperformed. Pundits have been attempting to find explanations for this phenomenon. Many compared Chinese big caps’ outperformance with the “Nifty-Fifty” era in the US in the 1970’s. The similarities between the two groups are more than just the number of stocks and their dominant position in their respective industry.
Unanimous bullish expectation for these industry leaders as they rise is the key. Back then, fund managers defined the risk of the Nifty-Fifty not as the risk of overpaying, but as the risk of missing out. Now, the Chinese funds huddle together in the A50 stocks as a risk shelter, instead of a growth engine. Regardless, the ubiquitous expectation in both periods is the key to significant outperformance. As we will discuss later, the relative return of China’s big versus small caps is approaching extreme. The A50 stocks are now lovingly dubbed by some as China’s new “Nifty-Fifty”. But is that so?
In 1738, in a ground-breaking paper “Commentaries of the Imperial Academy of Science of Saint Petersburg”, Daniel Bernoulli attacked the hypothesis long held by mathematicians regarding expected value. “Expected values are computed by multiplying each possible gain by the number of ways in which it can occur, and then dividing the sum of these products by the total number of cases,” Bernoulli opened. “Although the facts are the same for everyone, the utility depends on the particular circumstances of the person making the estimate ... There is no reason to assume that the risks anticipated by each must be deemed equal in value.” He contended.
Bernoulli then introduced one of the greatest intellectual leaps in history - “the utility resulting from any small increase in wealth will be inversely proportionate to the quantity of goods previously possessed.” For the first time in history, someone is trying to calculate the sentiment of a human being. It is a quantum leap forward in our world view.
There are a number of illustrations of Bernoulli’s theory of utility in the paper. The most interesting one by far is the Petersburg Paradox, originally suggested by Daniel Bernoulli’s “most honorable and celebrated cousin”, the editor of “The Art of Conjecture” – Nicolas Bernoulli. In a game of coin tossing, Peter pays Paul double the previous sum with each additional throw, till the first head comes up. As Paul stands to win a sizable amount, how much is Paul’s privilege in this game worth? The paradox arises because although the expected value of Paul’s prospects appears infinite, “no one would be willing to purchase at a moderately high price,” as Bernoulli posited. It is because “one thousand ducats are more significant to the pauper than to a rich man”.
If each participant’s utility is the same, however, the value of Paul’s privilege will indeed be very high. This theory can be used to explain occasional extreme valuation multiples attributed to growth stocks. In the 1970’s, ubiquitous growth expectation for the Nifty-Fifty contributed to these stocks’ strong performance. But as Prof. Jeremy Siegel later calculated, a portfolio of equal-weighted Nifty-Fifty stocks bought at their peak of 1972 would have yielded one percent less per annum than the S&P 500 in the ensuing 20 years. While many of the Nifty-Fifty have grown to be the dominant leader in their respective industry, they still underperformed because of their high valuation. If so, should investors be concerned about the A50’s strong relative performance – especially now the ubiquitous expectation has stretched their relative return close to extreme?
Why China’s big caps outperform?
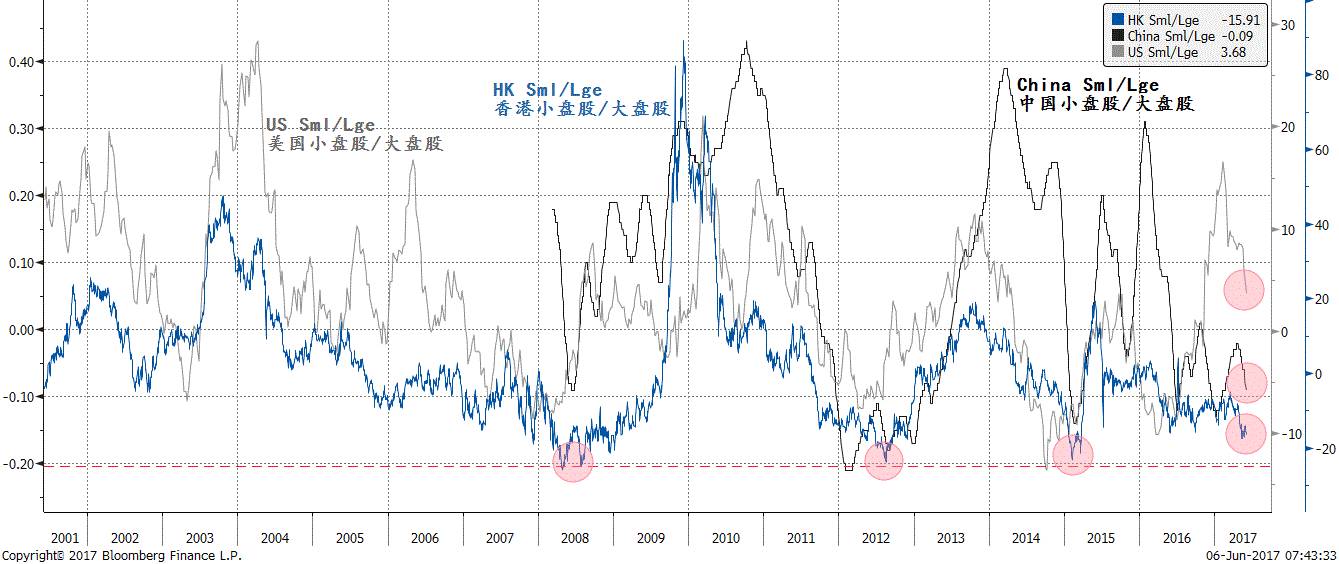
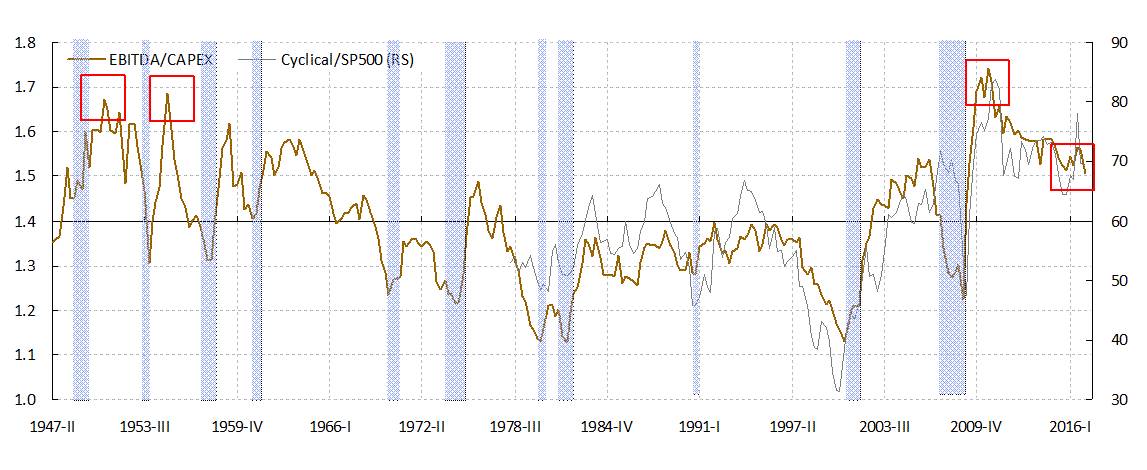
The puzzle - big caps are outperforming globally in an environment of strong risk appetite. In a seemingly risk-seeking environment, big caps are outperforming small caps globally – not only in China, but also in Hong Kong and in the US (Focus Chart 3). It is perplexing. In general, in a market with a strong risk appetite, small caps tend to outperform. And so do other cyclical assets, such as commodities and financials. But iron ore has plunged more than 30% from its March highs, and the US financials have regurgitated much of their gains YTD.
In our previous note titled “Re-pricing Risks under New Regulations”, we posited that the outperformance of big caps can be attributed to the widening credit spread between bonds of different credit quality. In an environment of differentiated funding costs, it is conceivable that big caps are outperforming because of their funding advantage.
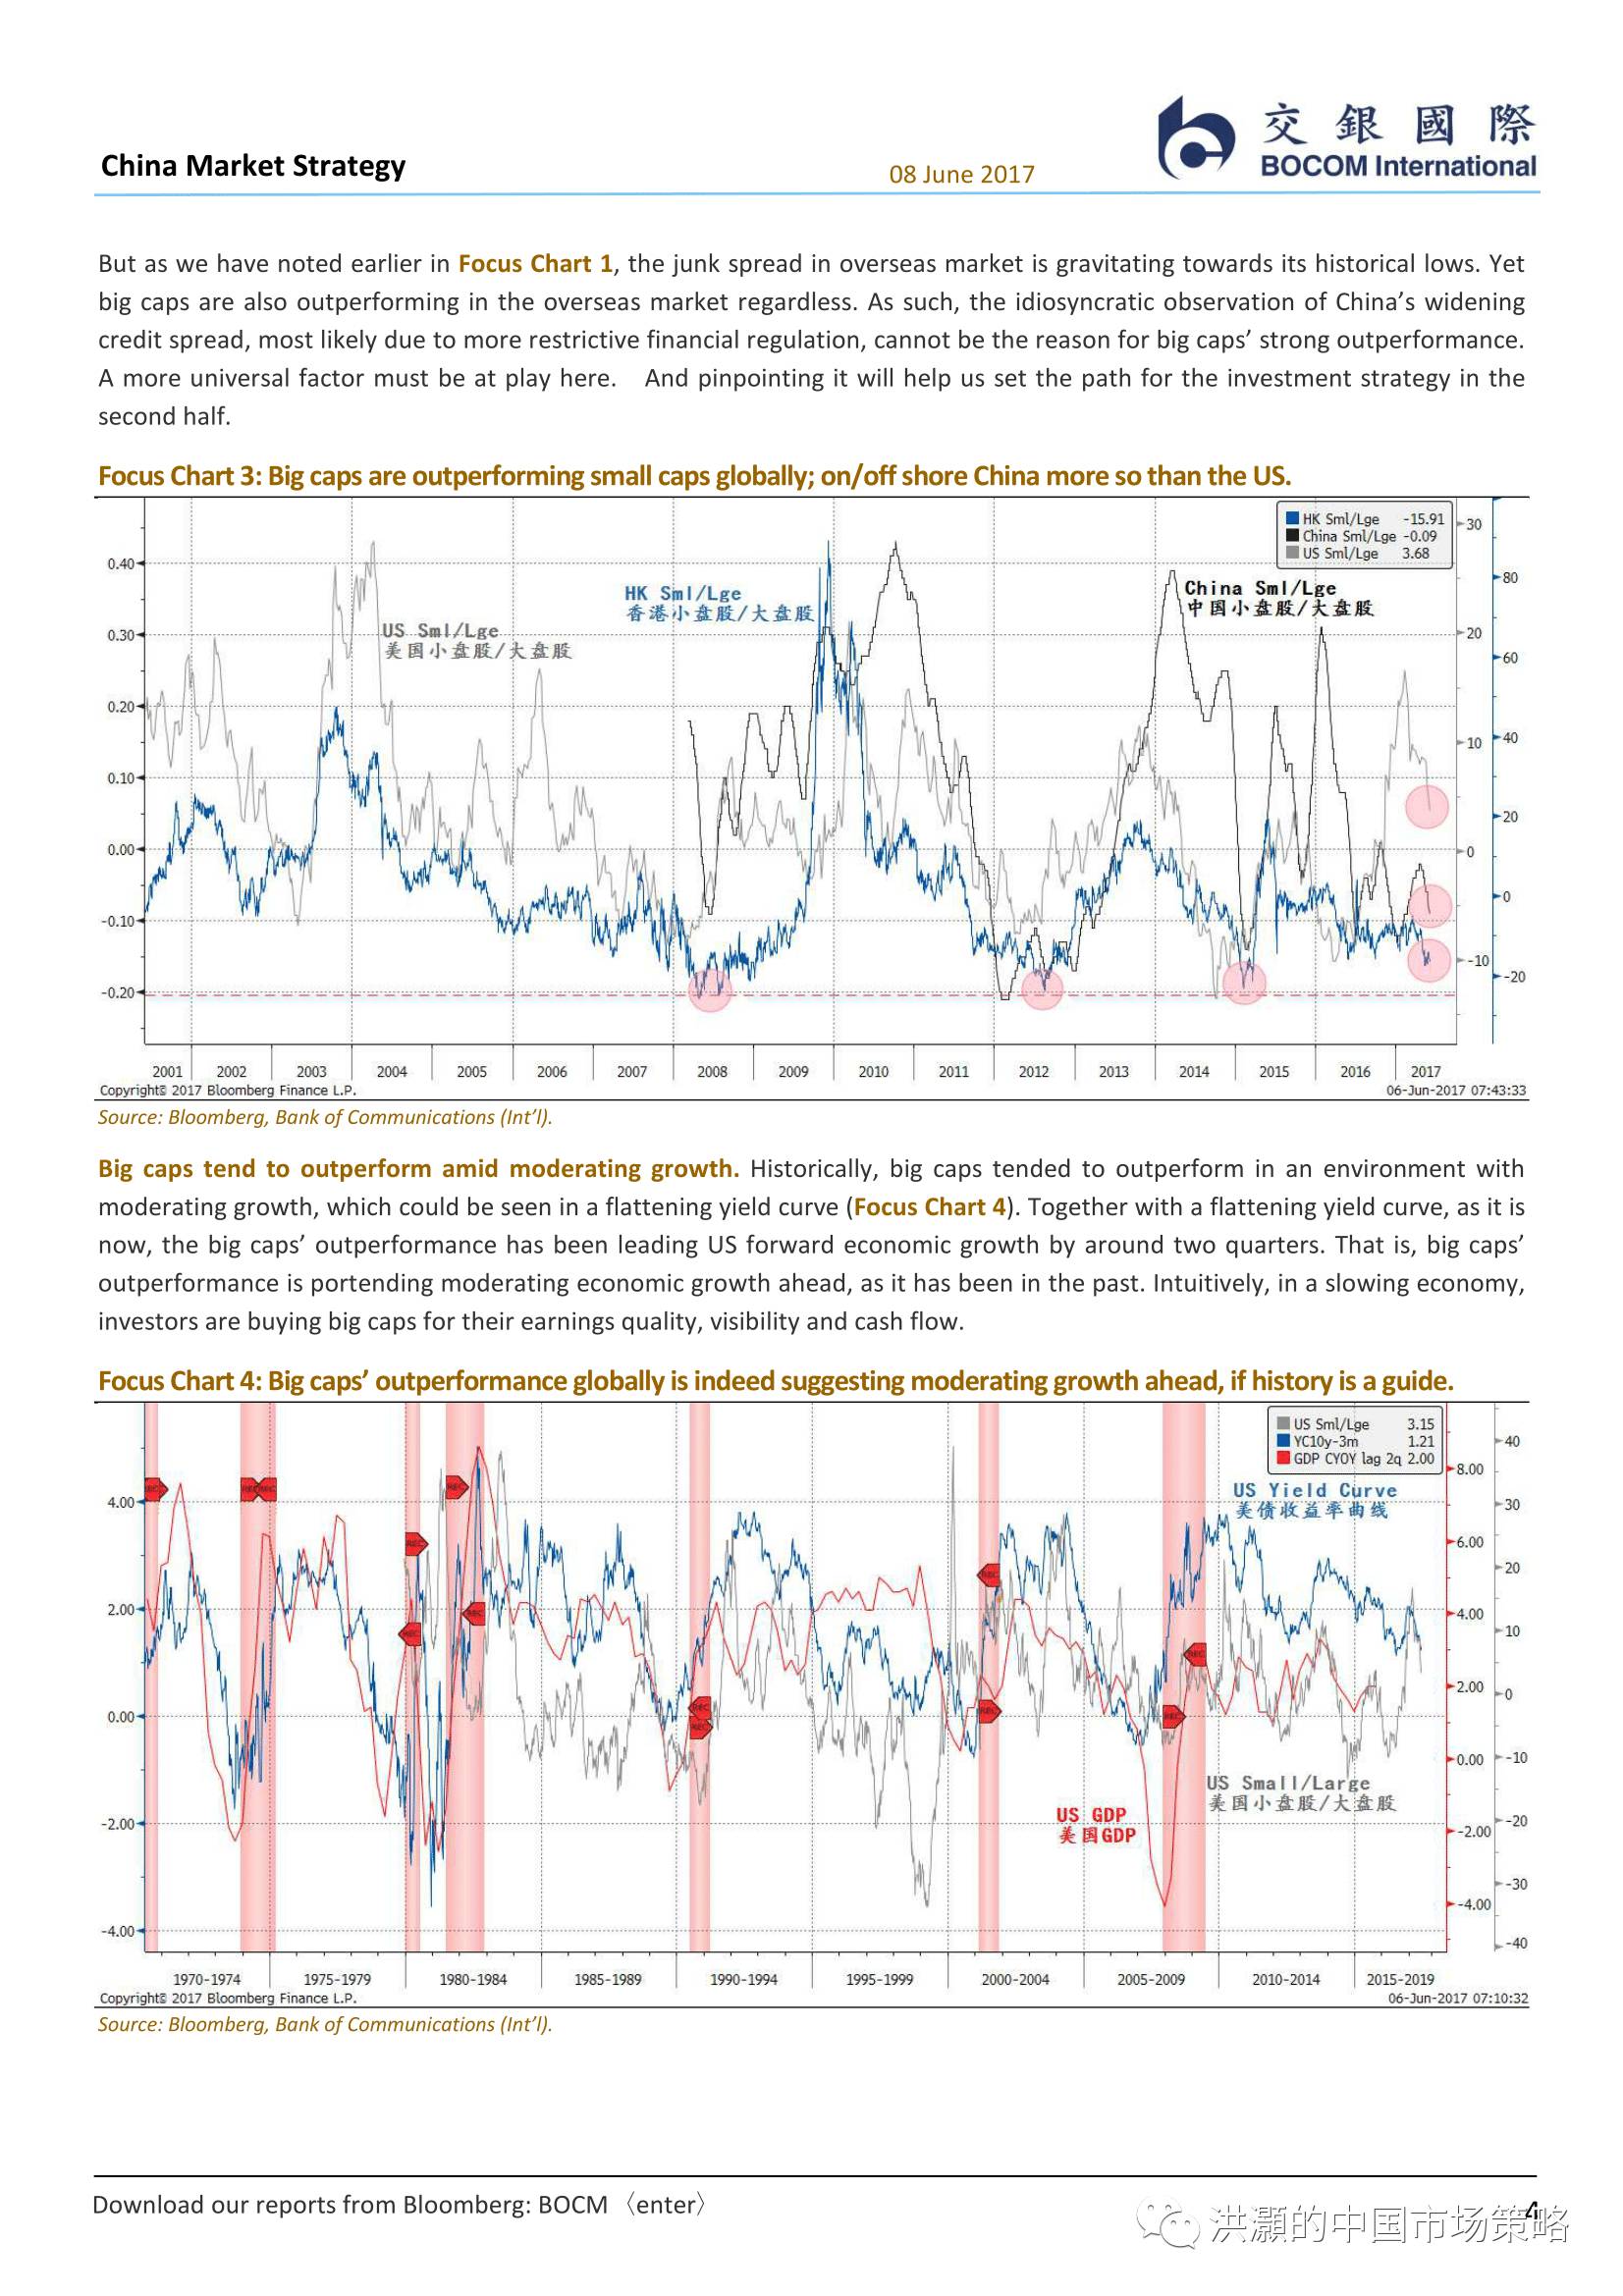
But as we have noted earlier in Focus Chart 1, the junk spread in overseas market is gravitating towards its historical lows. Yet big caps are also outperforming in the overseas market regardless. As such, the idiosyncratic observation of China’s widening credit spread, most likely due to more restrictive financial regulation, cannot be the reason for big caps’ strong outperformance. A more universal factor must be at play here. And pinpointing it will help us set the path for the investment strategy in the second half.
Focus Chart 3: Big caps are outperforming small caps globally; on/off shore China more so than the US.
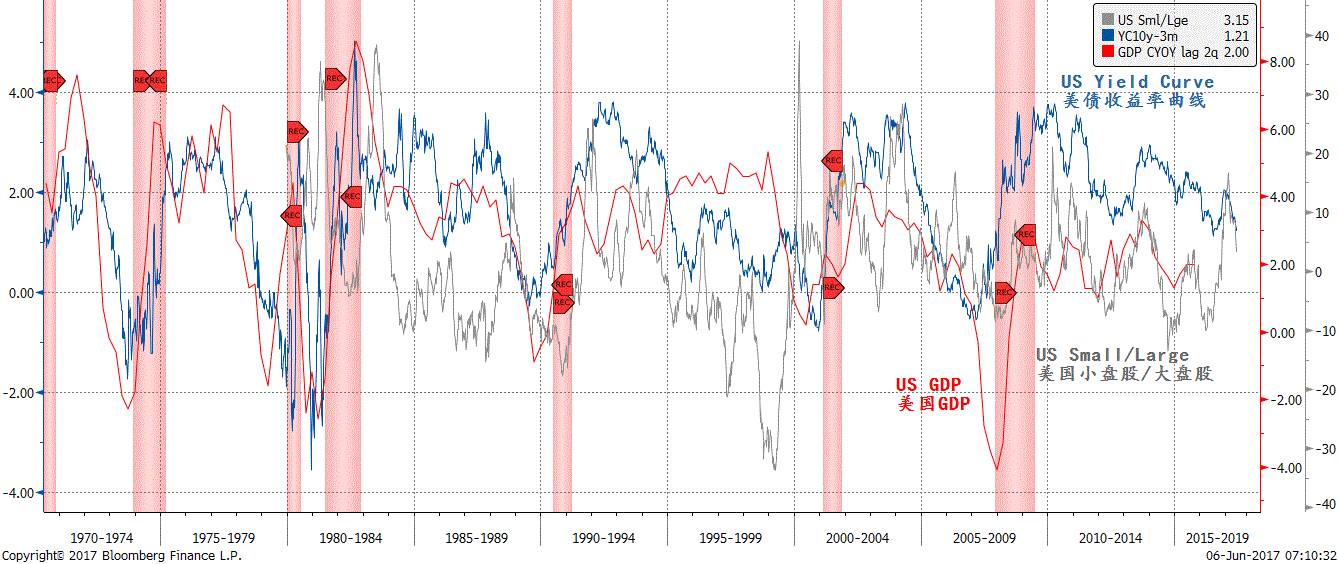
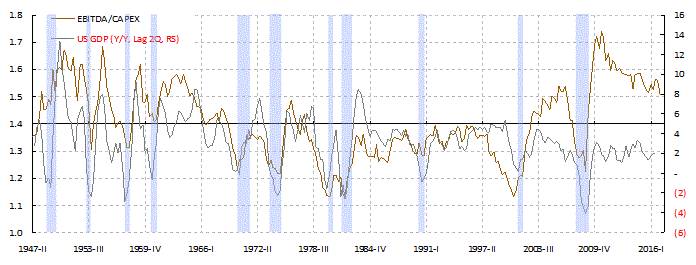
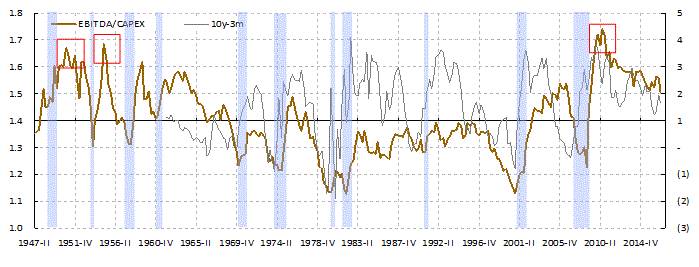
Big caps tend to outperform amid moderating growth. Historically, big caps tended to outperform in an environment with moderating growth, which could be seen in a flattening yield curve (Focus Chart 4). Together with a flattening yield curve, as it is now, the big caps’ outperformance has been leading US forward economic growth by around two quarters. That is, big caps’ outperformance is portending moderating economic growth ahead, as it has been in the past. Intuitively, in a slowing economy, investors are buying big caps for their earnings quality, visibility and cash flow.
Focus Chart 4: Big caps’ outperformance globally is indeed suggesting moderating growth ahead, if history is a guide.
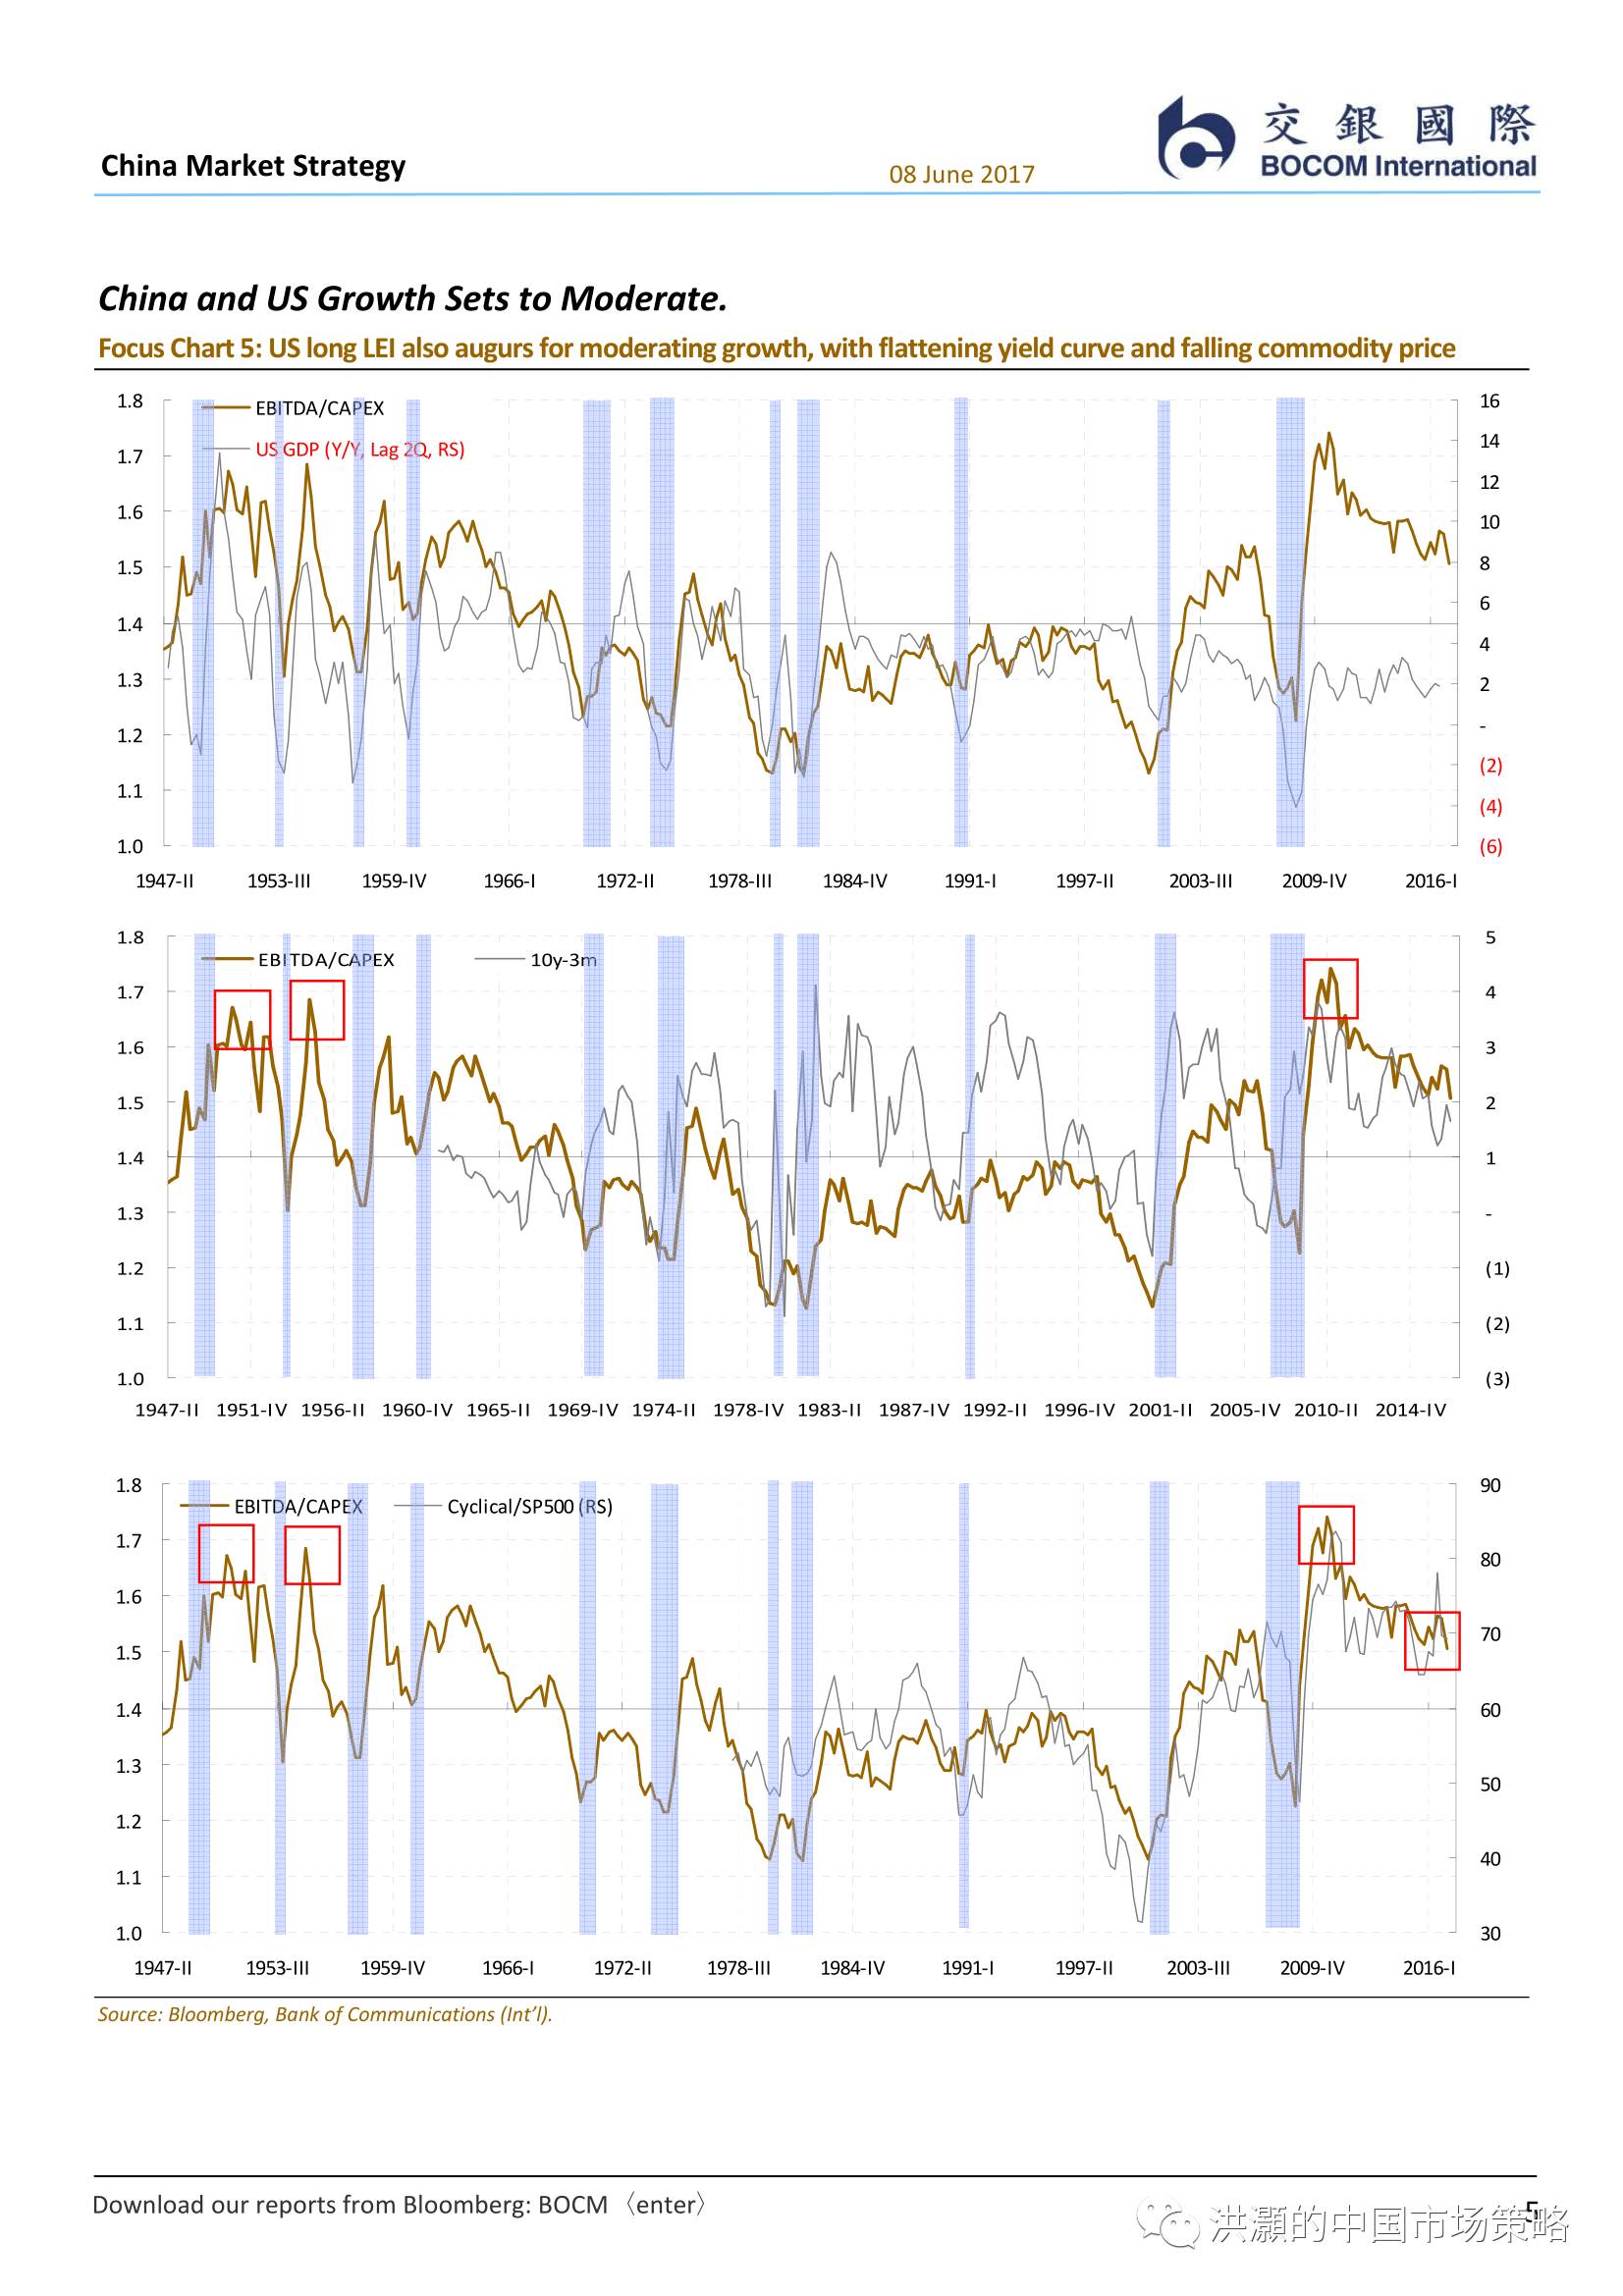
China and US Growth Sets to Moderate.
Focus Chart 5: US long LEI also augurs for moderating growth, with flattening yield curve and falling commodity price
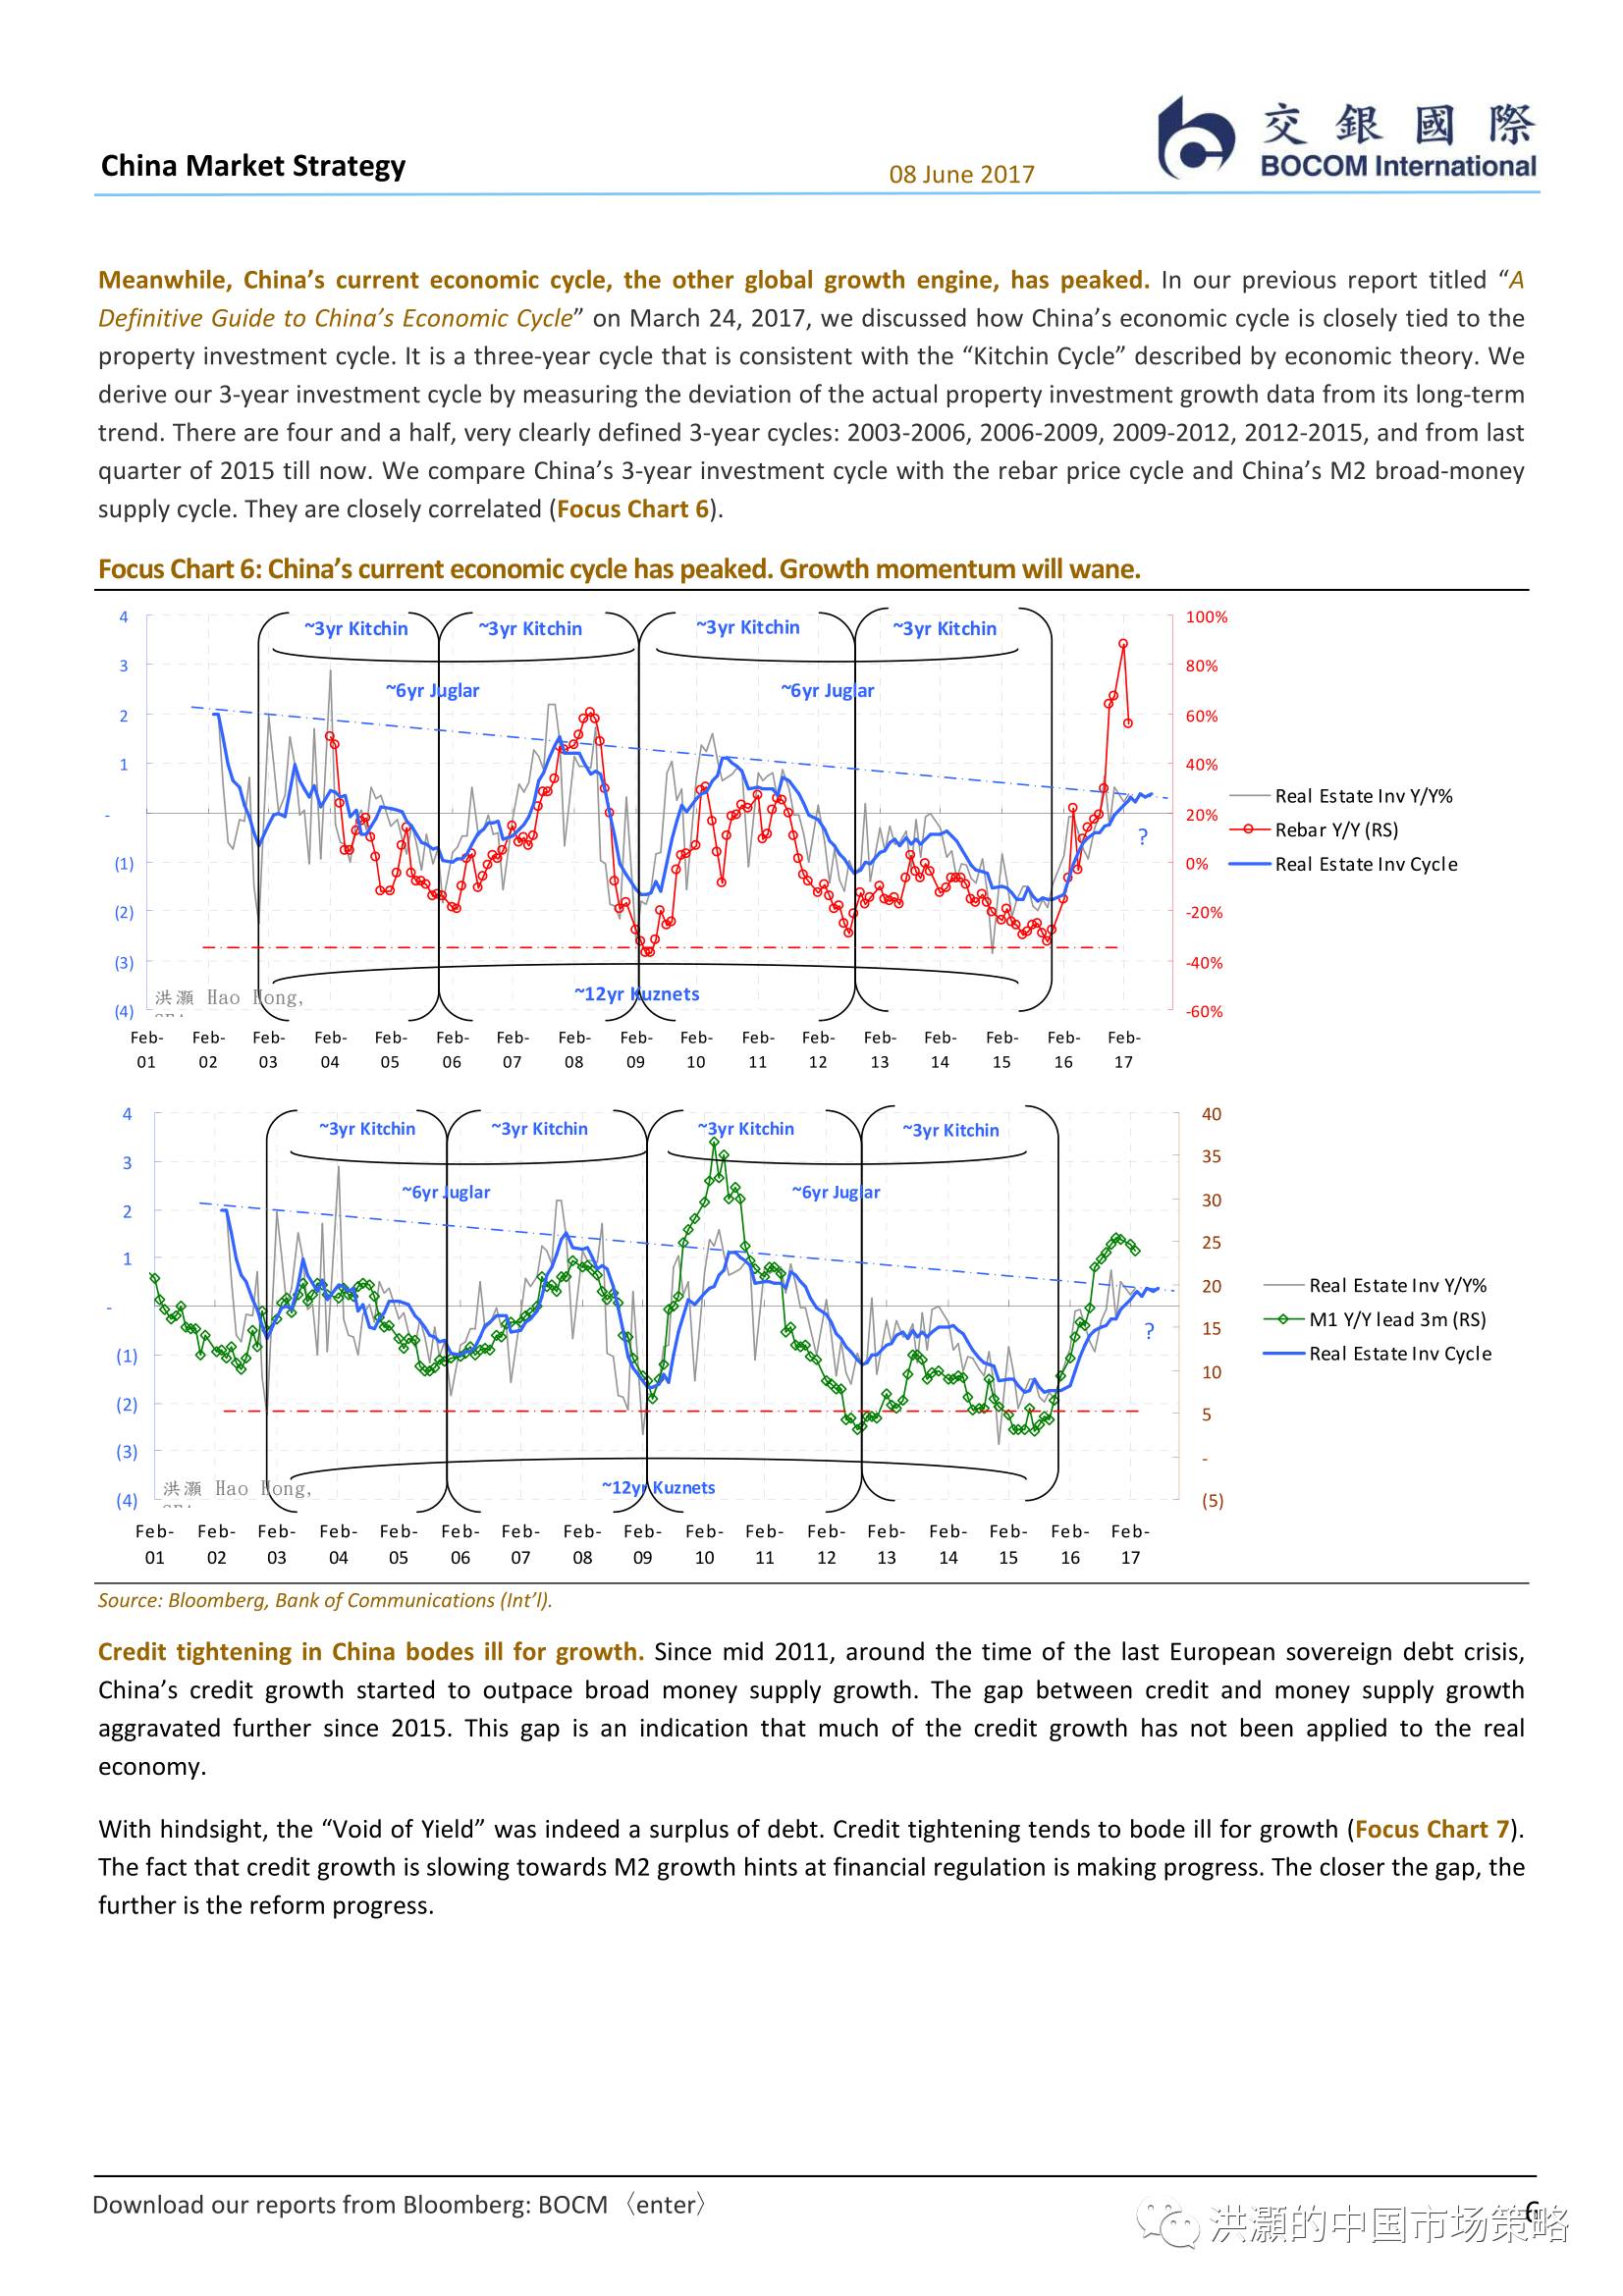
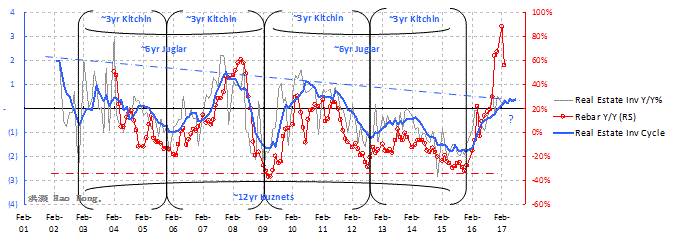
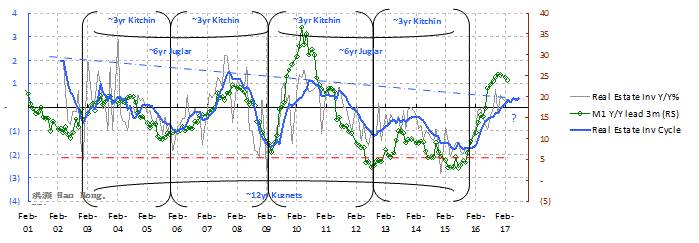
Meanwhile, China’s current economic cycle, the other global growth engine, has peaked. In our previous report titled “A Definitive Guide to China’s Economic Cycle” on March 24, 2017, we discussed how China’s economic cycle is closely tied to the property investment cycle. It is a three-year cycle that is consistent with the “Kitchin Cycle” described by economic theory. We derive our 3-year investment cycle by measuring the deviation of the actual property investment growth data from its long-term trend. There are four and a half, very clearly defined 3-year cycles: 2003-2006, 2006-2009, 2009-2012, 2012-2015, and from last quarter of 2015 till now. We compare China’s 3-year investment cycle with the rebar price cycle and China’s M2 broad-money supply cycle. They are closely correlated (Focus Chart 6).
Focus Chart 6: China’s current economic cycle has peaked. Growth momentum will wane.
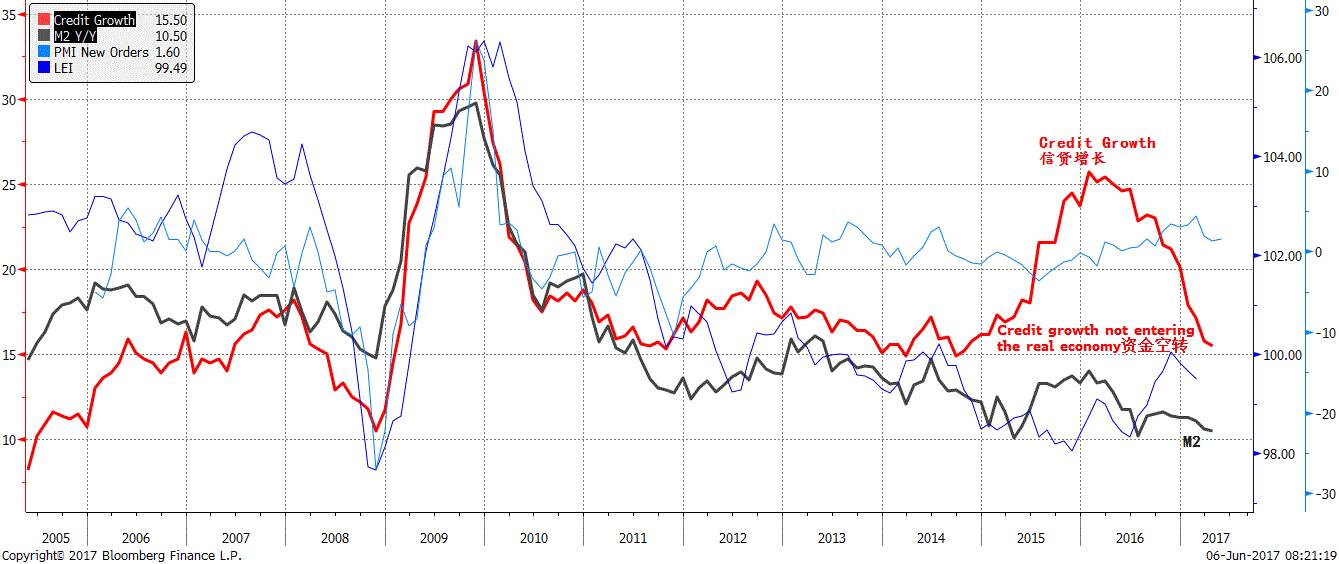
Credit tightening in China bodes ill for growth. Since mid 2011, around the time of the last European sovereign debt crisis, China’s credit growth started to outpace broad money supply growth. The gap between credit and money supply growth aggravated further since 2015. This gap is an indication that much of the credit growth has not been applied to the real economy.
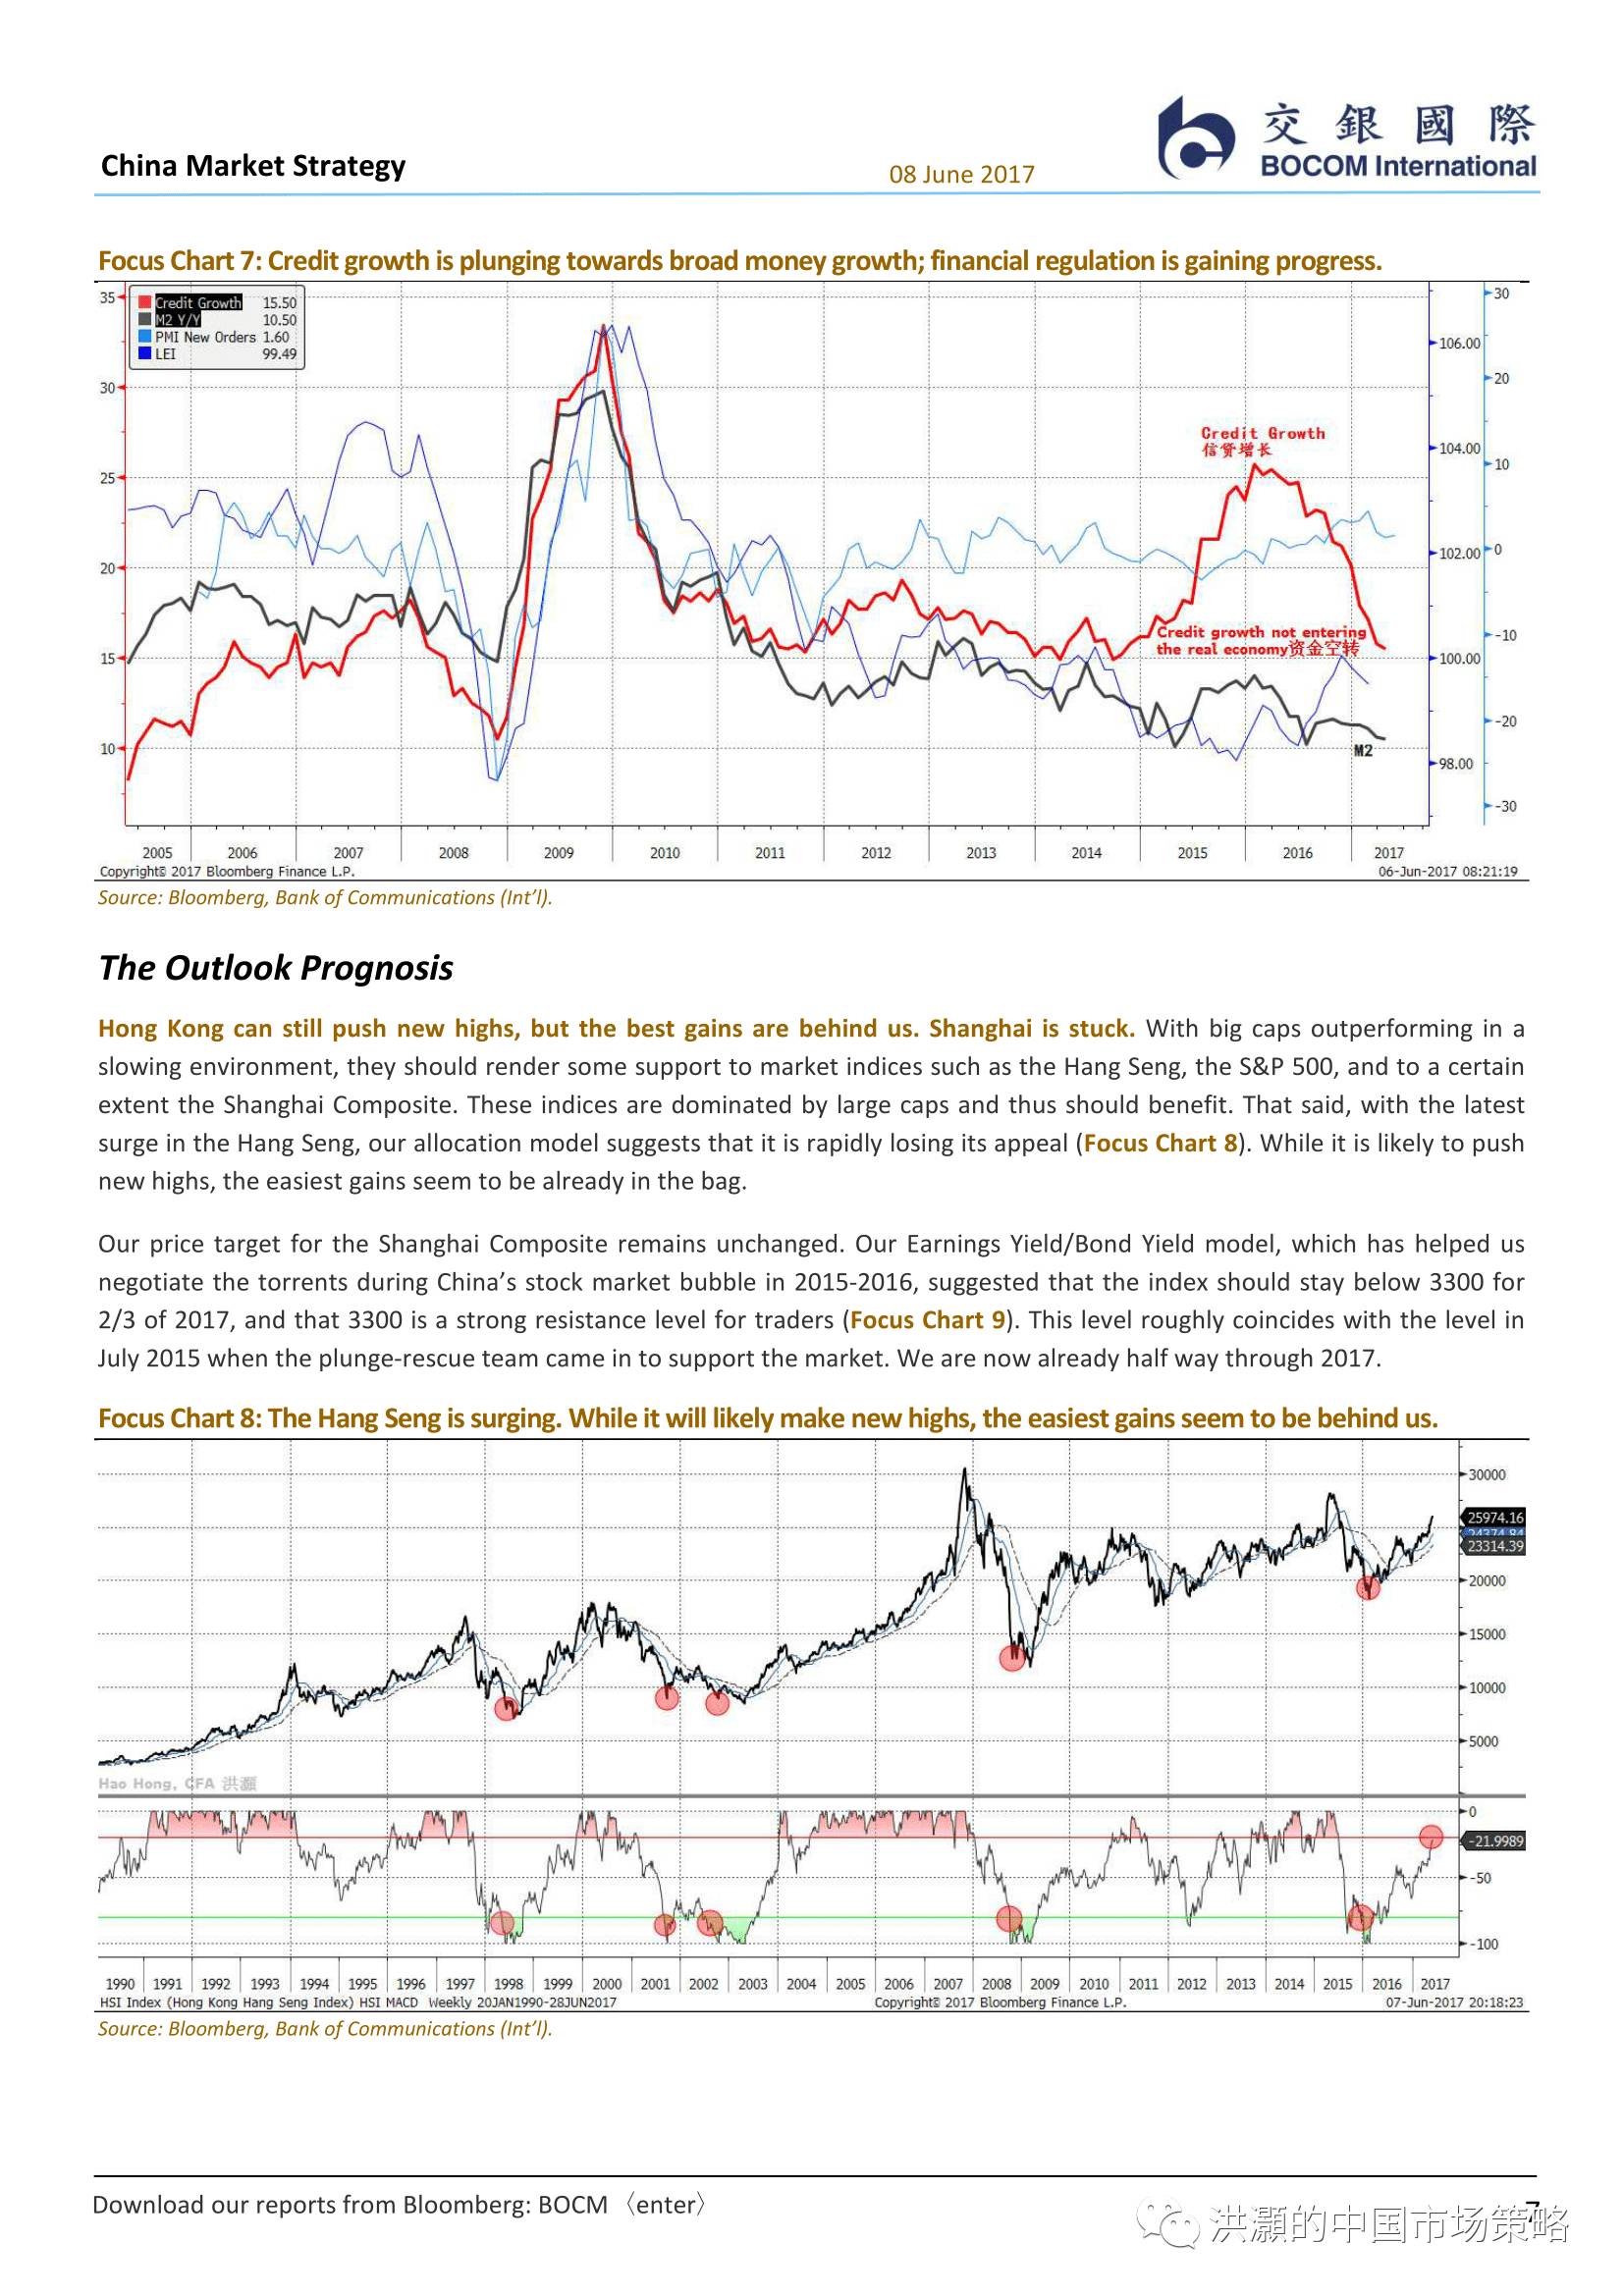
With hindsight, the “Void of Yield” was indeed a surplus of debt. Credit tightening tends to bode ill for growth (Focus Chart 7). The fact that credit growth is slowing towards M2 growth hints at financial regulation is making progress. The closer the gap, the further is the reform progress.
Focus Chart 7: Credit growth is plunging towards broad money growth; financial regulation is gaining progress.
The Outlook Prognosis
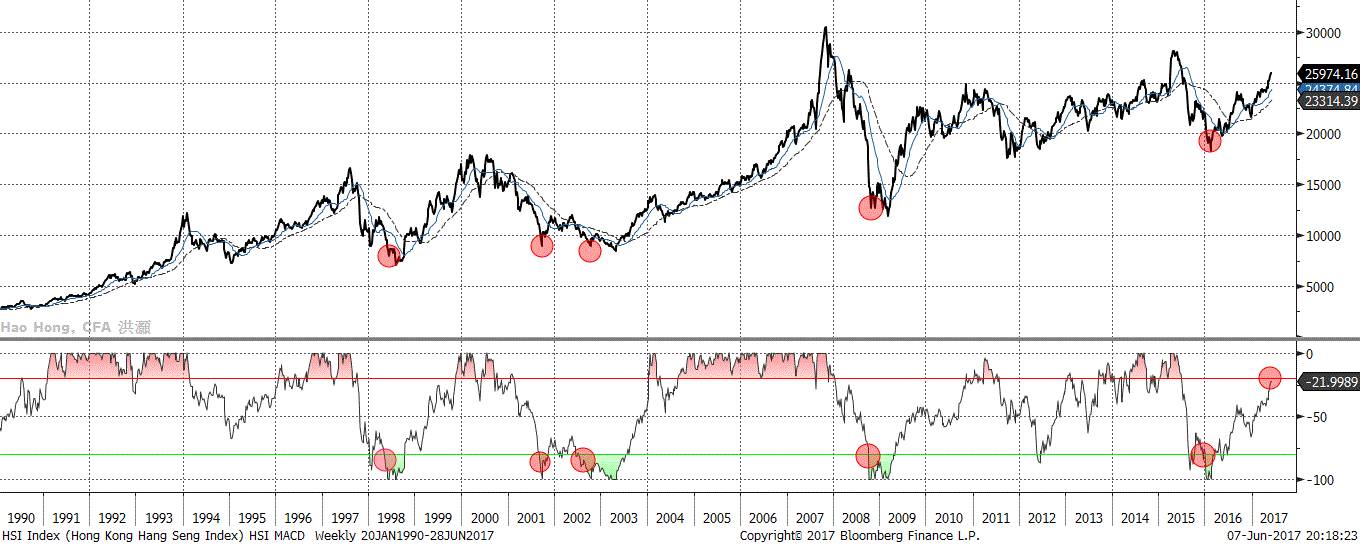
Hong Kong can still push new highs, but the best gains are behind us. Shanghai is stuck. With big caps outperforming in a slowing environment, they should render some support to market indices such as the Hang Seng, the S&P 500, and to a certain extent the Shanghai Composite. These indices are dominated by large caps and thus should benefit. That said, with the latest surge in the Hang Seng, our allocation model suggests that it is rapidly losing its appeal (Focus Chart 8). While it is likely to push new highs, the easiest gains seem to be already in the bag.
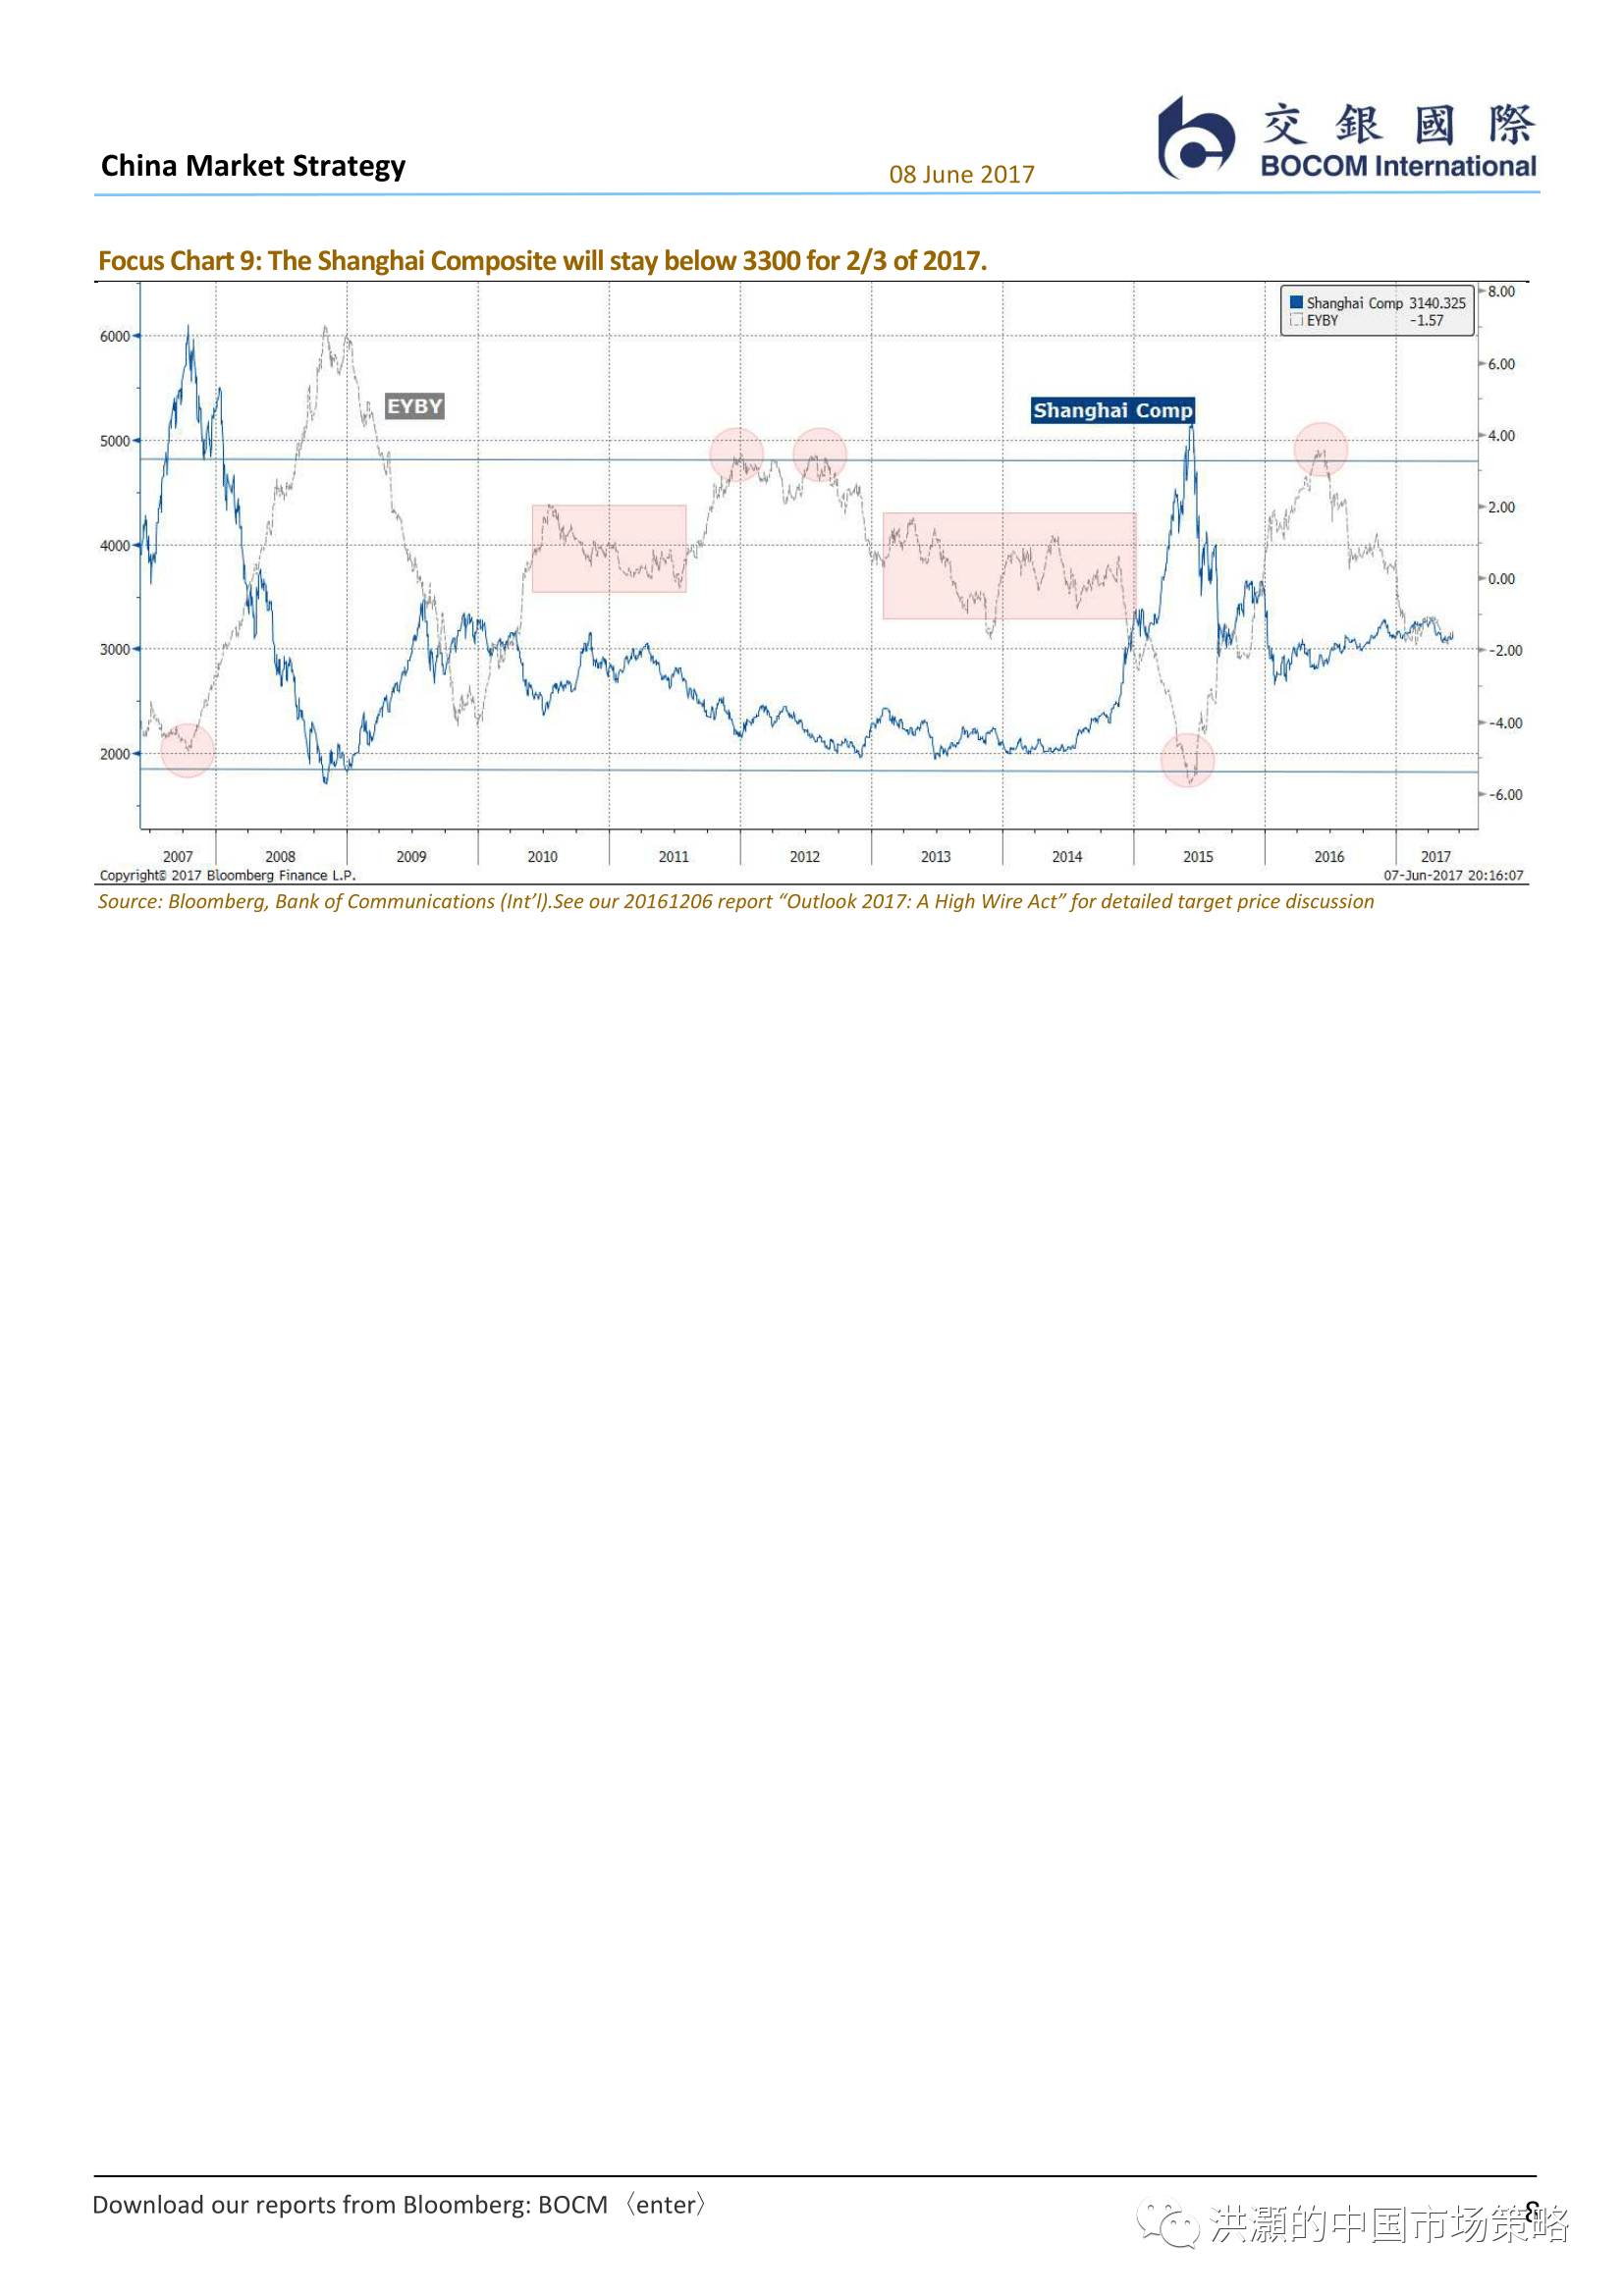
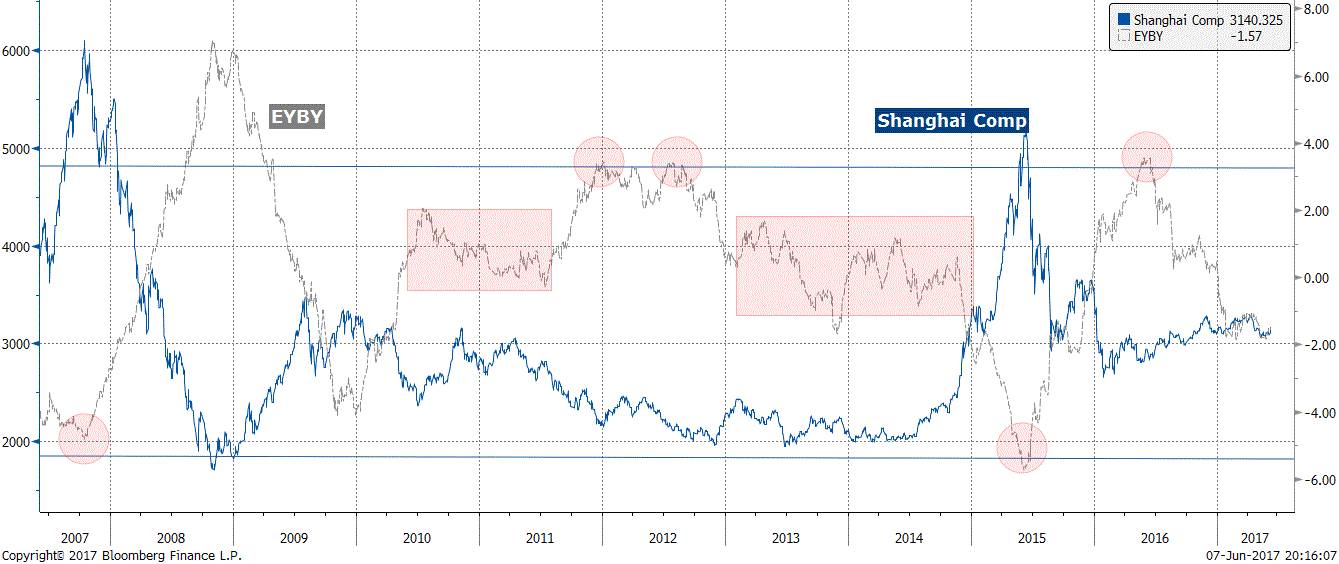
Our price target for the Shanghai Composite remains unchanged. Our Earnings Yield/Bond Yield model, which has helped us negotiate the torrents during China’s stock market bubble in 2015-2016, suggested that the index should stay below 3300 for 2/3 of 2017, and that 3300 is a strong resistance level for traders (Focus Chart 9). This level roughly coincides with the level in July 2015 when the plunge-rescue team came in to support the market. We are now already half way through 2017.
Focus Chart 8: The Hang Seng is surging. While it will likely make new highs, the easiest gains seem to be behind us.
Focus Chart 9: The Shanghai Composite will stay below 3300 for 2/3 of 2017.
See our 20161206 report “Outlook 2017: A High Wire Act” for detailed target price discussion
请点击“阅读原文”观看我在2016年12月初与吴晓波录制的专访《2017年股市钱途在哪里?》。关于港股、大盘股、龙头股和科技股在2017年的投资机会。

Hao Hong, CFA
2017-06-08