点击蓝色字体  关注我们
关注我们

- 第一作者单位:Department of Environmental Engineering, Pusan National University, Busan 46241, Republic of Korea
- 原文连接:https://doi.org/10.1016/j.scitotenv.2024.176585
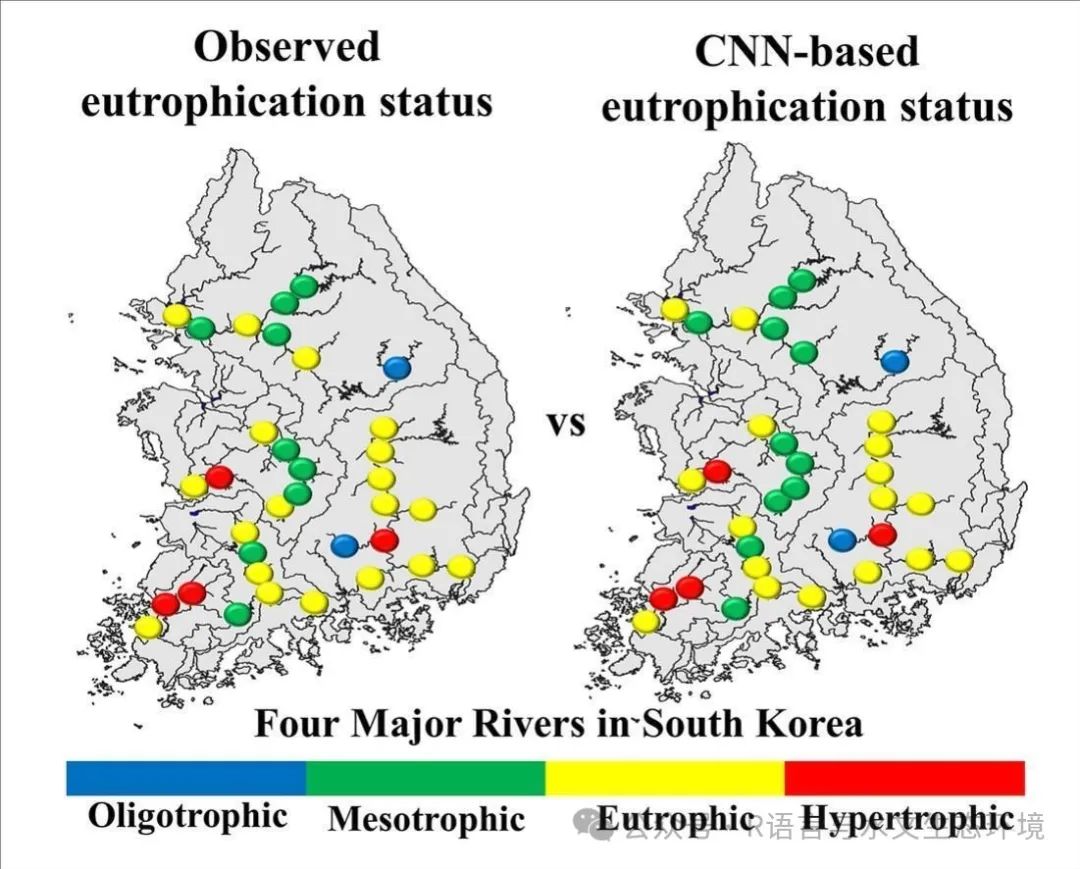
由于严重的水华现象,富营养化是韩国水质恶化的主要原因。为了治理水体富营养化,韩国政府提供了营养状态指数( TSIko ),该指数根据Carlson的TSI进行了修订。利用机理性水质模型对TSIko水平进行了模拟。然而,模型参数校正的计算复杂性和水质动力学的非线性使得分析精确的富营养化条件变得十分困难。深度学习模型被认为是数值模型方法的替代品,因为它们在没有先验知识的情况下直接提取水质变量。特别地,卷积神经网络( CNN )模型从复杂的数据集中表现出稳健的特征提取能力。本研究利用2014 - 2022年韩国Han、Guem、Yeongsan和Nakdong河流9年的水质数据构建并优化CNN模型,对TSIko进行分类。CNN模型使用分类准确率的统计测量提供验证结果,称为F1分数,这是精确率和召回率的调和平均值。贫营养、中营养、富营养和肥胖者的F1值分别为0.922、0.950、0.964和0.896。CNN模型优于传统的机器学习模型。随后,使用CNN模型生成了四条主要河流的富营养化地图,以模拟富营养化指数的空间和时间变化,模拟了Yeongsan河和Nakdong河干流和支流的高时空富营养化动态。因此,本研究证明了CNN模型在韩国主要河流的各种空间和时间尺度上分析富营养化状况的能力。


Fig. 1. Overview of procedural steps; a) water quality data collection from four major rivers and TSIko value calculation using TN, COD, and Chl-a variables, b) Construction and optimization of deep learning model and conventional machine learning models, c) performance comparison of eutrophic status classification between data-driven models, and d) spatio-temporal mapping of eutrophic condition by selecting optimal model. |

Fig. 2. Study area for water quality sampling and measurements of the four major rivers in South Korea's watershed; (a) Han River, (b) Geum River, (c) Yeongsan River, and (d) Nakdong River. |

Fig. 3. Optimized CNN structures for the classification of eutrophication indices. |

Fig. 4. The relationship between TSIko(COD), TSIko(TP), TSIko(Chl-a), and eutrophication levels (1-oligotrphic, 2-mesotrophic, 3-eutrophic, and 4-hypertrophic) for the following regions; (a) Pyeongchang in the Han River, (b) Hyundo in the Geum River, (c) Boseong in the Yeongsan River, and (d) Sangju in the Nakdong River. |

Fig. 5. Representation of the confusion matrix for TSI level classification results using a CNN model; a) Training set, b) Validation set |

Fig. 6. Map and bar graph of TSI indices for 34 locations during August 2022; a) Observations, b) Model results. |

Fig. 7. Results of TSI level classification of the CNN model across four seasons in 2022; a) observations on January, b) observations on April, c) observations on July, d) observations on November, e) model results on January, f) model results on April, g) model results on July, and h) model results on November. |

- 免责声明:本文遵循微信公众平台各项保护原创的措施。推文可能未提前与原作者取得联系,或无法查证真实原作者,若涉及版权问题,请原作者留言联系我们。经核实后,我们会及时删除或者注明原作者及出处。本公众号原创文章,欢迎转载,转载时请注明出处。推文数据来源于网络,本文仅用于学术分享与传播。


