
敬请点击最下方“
阅读原文
”,或复制以下网址到浏览器,登录Asiamoney Brokers Poll 2018亚洲货币投票网址,为交银国际研究和销售
团队投出您宝贵的一票:
https://surveys.euromoney.com/s3/Asiamoney-Brokers-Poll-2018
投票说明详见我们之前的报告
《
中国投机权威指南
》。
----------------------
自2015年股市泡沫破灭以来,维稳一直是管理中国经济最重要的原则。然而自那以来,一个没有被充分讨论的市场特征,就是随着维稳工作的推进,市场波动性已跌至历史最低点。这就像是2016和2017年A50蓝筹股指数不断攀升的镜像。
这种性质的交易相当于做空市场波动性。这个交易已经在一月份的暴跌中轰然倒下。在和平时期做空看跌期权,以获得期权溢价,将在波动性重现时很快地获利回吐,甚至会把本金也亏掉。这就是A50指数自1月抛售以来表现不佳的原因。
以稳定为名,政策基调正在悄然转变。资产管理新规的细节表明,在过渡期内,将进一步放宽新规的具体实施。细节中的模糊措辞也似乎为新规的实际运行留下余地。尽管中国银监会的通知晦涩难懂,专家们的解释也如是,甚至更加冗长,但中国央行随后的补充说明暗示了监管呵护市场的意图。当面对困难的选择时,不要高估了自己的决心。
在一个超卖的市场,如此出乎意料的好消息应可以刺激技术反弹。但我们的长期配置模型仍然显示,尽管过度抛售,但市场寻底的过程往往旷日持久,就像2002年至2005年、2012年至2014年之间那样。
波动率激增时回报率的涨跌分布是对称的,其回报率与同时做多一个看涨和看跌期权类似。高波动率才能产生高回报,但也可能是大幅回撤的来源。正因如此,专家们呼吁在市场剧烈波动的情况下抄底,其实就像扔硬币一样——根本没有赢面优势。
市场见底不应如市场共识所建议的那样,被定义为一个指数的绝对最低水平。这种定义见底的目标是回报最大化,而不是风险最小化。因此,这个定义在哲学上与那些建议抄底的专家所提倡的价值投资是不一致的。更确切地说,市场底部很可能是一个区间。而在这个区间内,承担额外风险产生的边际回报会增加。在这份报告中,我们提出了一个简单的、利用长期移动平均来管理回撤风险的方法。
这是我们20180722的报告
《
反弹和见底
》
的英文原版《Rebound vs. Bottom》。感谢阅读。
---------------------------
The regulators have been following an overriding mantra of maintaining stability since the burst of the 2015 stock market bubble. A less-discussed market characteristic since then is that market volatility has plunged to its historic lows. It is like the mirror image of the rise of the A50 blue chip index in 2016 and 2017.
A trade of such nature is equivalent to the short volatility trade that collapsed in the selloff in late January. Shorting put options during peace time to collect option premium will promptly pay it back and more, when volatility resurfaces. It is the reason why the A50 index has significantly underperformed since the January selloff.
In the name of stability, policy tones are shifting. The details of the new rules on the asset management industry suggest further relaxation of the implementation of the rules during the transition period. The vague wording in the details also leaves leeway for the actual rollout of the new rules. While the announcement from the CBRC is almost inscrutable, and the pundits’ interpretations even more so and more verbose, the subsequent explanation from the PBoC hints at the regulator’s intent to ease the market’s nerves. One shall not overestimate one’s resolve when confronted with difficult choices.
In an oversold market, such unexpected good news can spur a technical rebound. But our long-term allocation model suggests that while oversold, the market bottoming process tends to be protracted, as it had been between 2002 and 2005, and from 2012 to 2014. The return distribution when volatility is surging is symmetrical on both the up and down sides, with a similar payoff as longing and shorting a call simultaneously. Volatility is necessary for big returns, but can also be a source of drawdown. As such, the pundits’ call to bottom fishing amid surging volatility is like tossing a coin – there is no winning edge whatsoever.
The market bottom should not be defined by its lowest absolute level, as suggested by consensus. Such an approach aims at return maximization, instead of risk minimization, and thus is philosophically inconsistent with value investing that is espoused by the same pundits who are calling a bottom. Rather, the market bottom is likely to be a range where additional risk-taking produces increase marginal returns. In this report, we propose a layman’s approach to manage downside risks using long-term moving average.
---------------------------
Subtle Policy Shift
Market stability comes with costs.
The aftermath of the 2015 stock market bubble is that the regulators are obsessed with an overriding mantra of stability: from the national team intervening during the burst of the market bubble, to encouraging households to leverage up to destock property inventory, as well as the aggressive monetary easing through PSL in the name of “developing shanty-down”. Recently, the flurry of policy rollout and its pace amid surging market volatility make it feel like 2015 once more – a time when the campaign to stabilize the market eventually quell the relentless selling pressure.
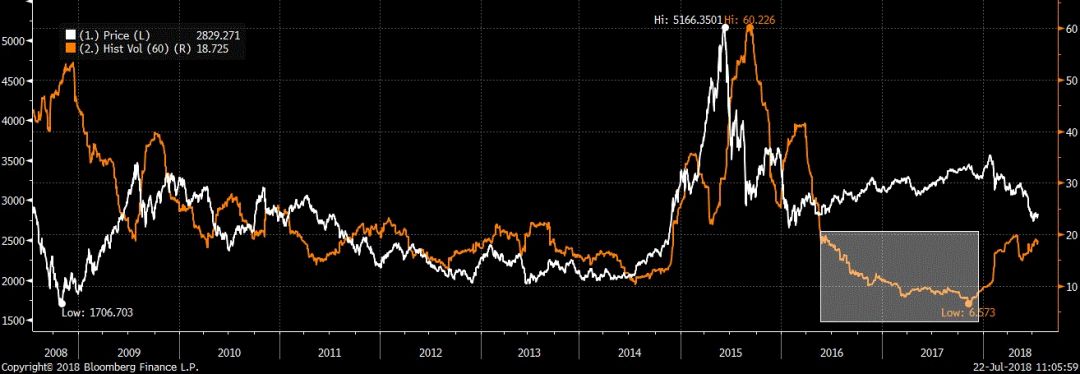
But there is a price to pay. A less-discussed market characteristic since the burst of the bubble is that volatility has plunged to historic lows, amid the maneuvers to stabilize the market (
Figure 1
). While market volatility has surged back of late, it is still substantially below its historical average. With macro liquidity receding on the margin, it is likely that volatility will rise further. Stability breeds instability. And the process of market bottoming will be protracted, as China undoes the leverage it had accumulated to combat economic malaises in the past few years.
Figure 1: While maintaining stability, the volatility of the Shanghai Comp plunges to
historical
low
Recent policy moves suggest tactical easing.
When confronted with difficult choices, one shall not underestimate people’s brittleness to deflect from the original intent. There have been many interpretations of the new rules on the asset management industry, and some interpretations from pundits are even more verbose than the new rules themselves.
But in general, we detect a stealth shift in policy tones by observing some bends on the existing guidelines announced just a few months ago. These bends include that mutual funds can now invest in non-standard instruments, funds’ valuation is allowed not mark-to-market (cost amortized), existing funds can be reinvested into new products and duration mismatching is permitted during the transition period,as well as more latitude when bringing back off-balance-sheet items – amongst the other subtle changes.
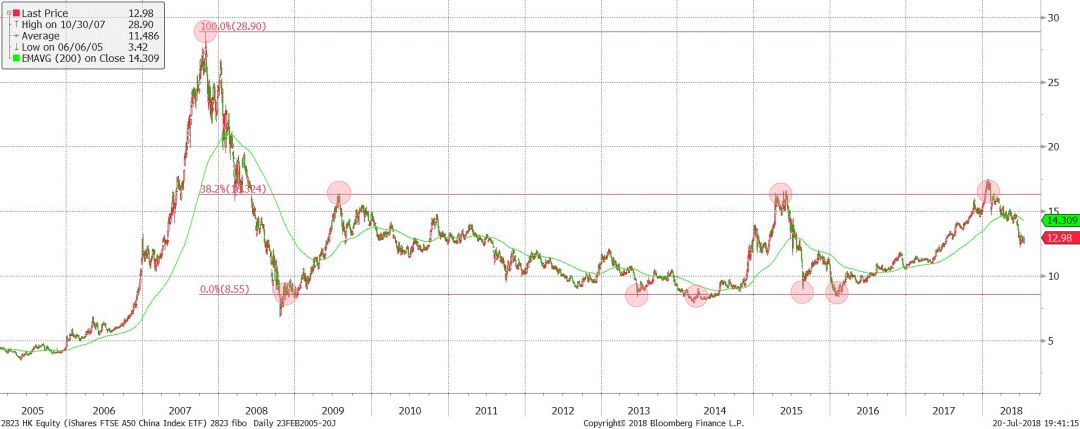
The technical details will continue to make the actual implementation challenging. However, without delving into the nitty-gritties, the changes, even though subtle, hint at a shift in policy tones. Further, while the announcement from the CBRC is full of details and almost inscrutable, the subsequent supplemental explanation from the PBoC suggests a strong intention to calm the market’s nerves. In an oversold market such as this, this news, together with the recent timely but measured liquidity relief from the central bank, can spur a technical rebound. But they are unlikely to change the general down trend (
Figure 2
).
Figure 2: The Fibonacci trading range of the A50 ETF has peaked, and is falling towards its lower bound
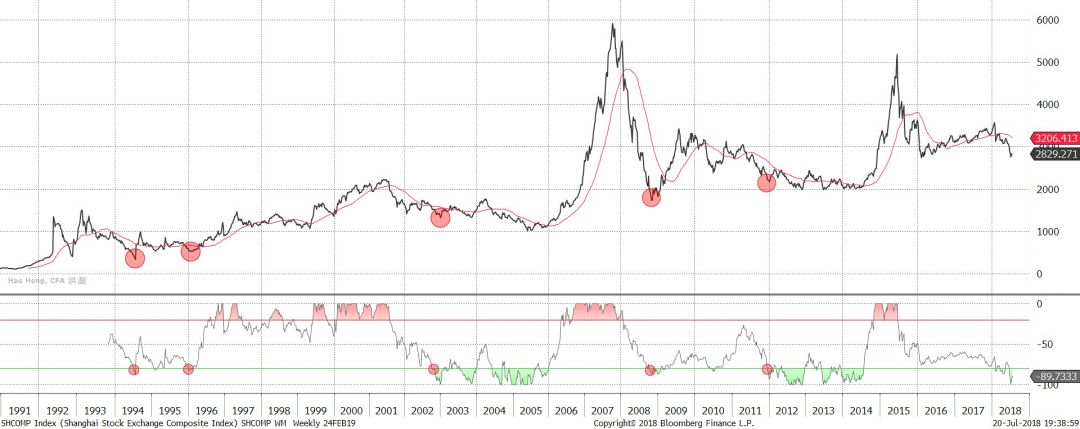
Our long-term allocation model suggests that the market bottoming process tends to be extended and quite involved, as it had been between 2002 and 2005, and 2012 and 2014. The v-shaped market bottom seen in late 2008 is a result of the decisive four-trillion-yuan stimulus amid the worsening global financial crisis. The policy stance is still far from a similar inflection point as in November 2008. And till this day, we are still paying for the consequences – the long-term cost associated with maintaining market stability.
Figure 3: Our long-term allocation model suggests market bottoming is a prolonged process
Redefin
ing Market Bottom – A New Perspective
Risk
is both a foe and a friend of return.
Recently, the chanting of market bottom has been growing ever louder. Yet the market dives lower. As aforementioned, the stability campaign since the burst of 2015 market bubble comes with a price. As the most sensitive assets with an actively traded secondary market, stocks are the first to reflect the “accomplishments” of the said campaign – with market volatility plunging to historic lows.
The underlying premise to maintaining stability is that market volatility is nefarious. Yet, in
Figure 4
we show that volatility can be a necessity of return when the market is rising, but also a trigger for drawdown when the market is falling. As the regulator tries to manage away market volatility, it has also gradually eliminated the source for return.
It is for this reason that last year a majority of the stocks fell in the Shanghai Composite, even though the overall index has managed to deliver very positive returns. The mirror image of the long A50 trade last year is the declining market volatility to its historic lows.


