文章介绍了如何从单细胞umap图中获取部分点的坐标,并对这些点进行后续操作。以Seruat的pbmc数据为例,文章详细描述了以下步骤:查看umap plot并确定需要获取点的位置,使用plotly手动绘制可交互的umap plot,通过shiny打开交互式umap plot并使用套索工具获取选区边界,在shiny页面圈选感兴趣的区域,读取套索选区并找到点坐标。
使用Seruat的pbmc数据,通过RunUMAP和DimPlot函数查看降维图,确定需要获取点的位置。
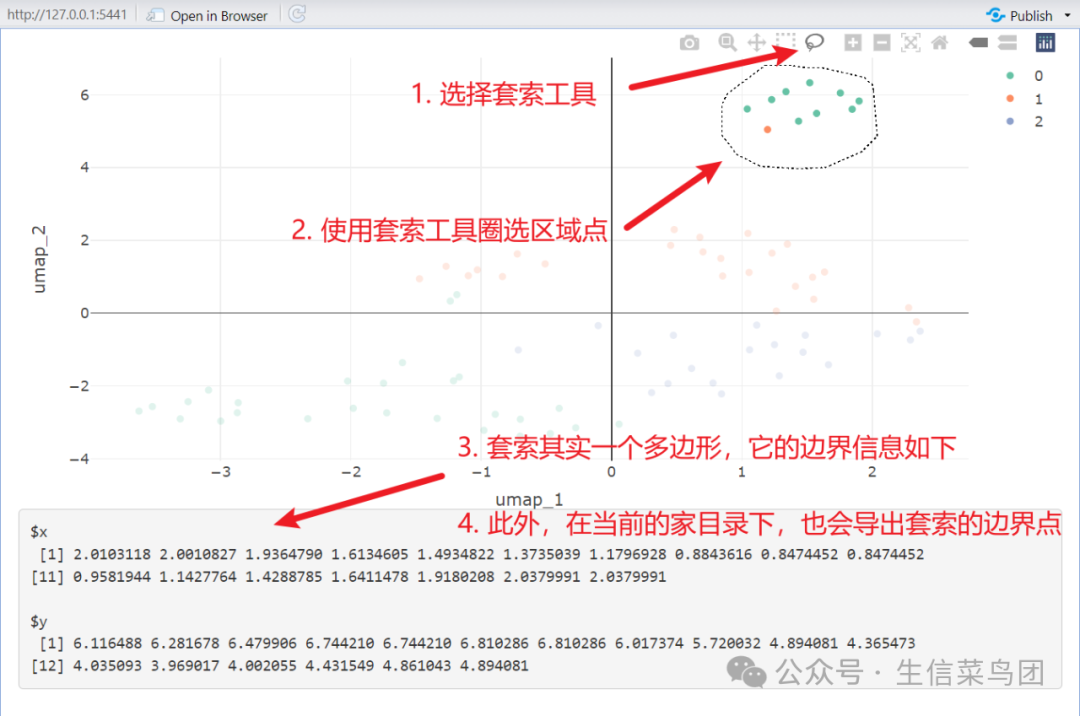
借助shiny包将交互式umap plot打开,利用套索工具圈选感兴趣的区域,程序会自动将选区边界坐标导出到指定文件中。
读取保存的套索选区文件,使用sp包计算所有在选区中的点,并在umap图中展示套索选区和选中的点。
有的时候需要获取单细胞umap图中的部分点的坐标,并对其进行后续操作。
本文提供一种方法用于实现这个目的。
以Seruat的pbmc数据为例。
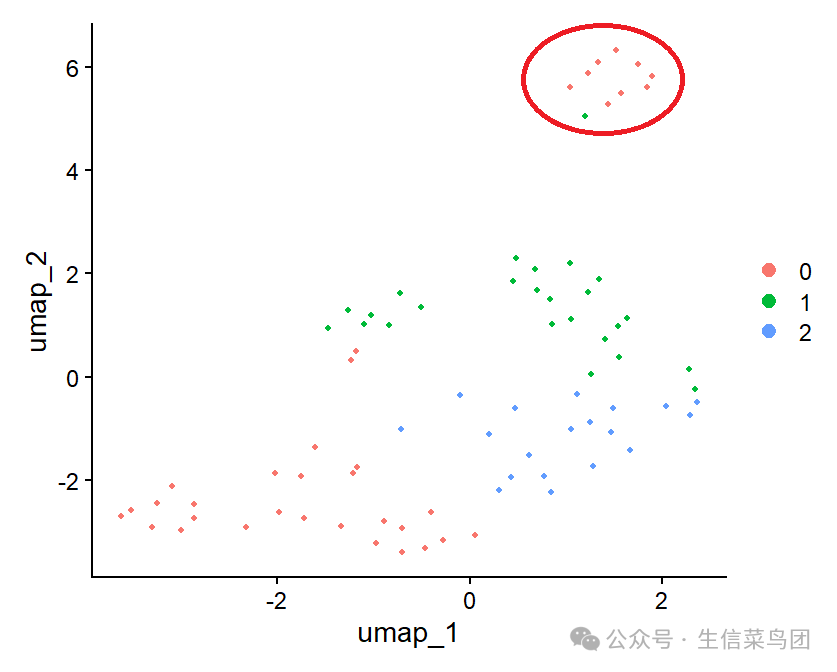
1. 查看umap plot,检查需要获得的点
library(tidyverse)
library(Seurat)
#1. 查看umap plot,检查需要去除的点
pbmc_small <- pbmc_small %>% RunUMAP(dims = 1:10)
DimPlot(pbmc_small)
查看降维图,并考虑获得右上角的点的坐标。
2. 使用plotly手动绘制可交互的umap plot
使用plotly手动实现这个umap plot散点图。
library(plotly)
umap_df <- pbmc_small[['umap']]@cell.embeddings %>%
as.data.frame() %>%
rownames_to_column("cell_id") %>%
left_join(
pbmc_small[['RNA_snn_res.1']] %>% rownames_to_column("cell_id"),
by = "cell_id"
)
# 实际项目中,数据点太多,只需要随机选择部分点绘制
# 能找到目标区域的位置即可
sub_umap_df <-
umap_df %>%
group_by(RNA_snn_res.1) %>%
slice_sample(n = 10000)
p <-
plot_ly(showlegend = T) %>%
add_markers(data = sub_umap_df, x= ~umap_1, y = ~umap_2, text = ~
cell_id, color = ~RNA_snn_res.1, tooltip = c('x', 'y'))
3. 将交互式的umap plot使用shiny打开,并可以使用套索工具获得选区边界
library(shiny)
library(plotly)
ui <- fluidPage(
plotlyOutput("plot"),
verbatimTextOutput("selected"),
)
server <- function(input, output, session) {
output$"plot-text" <- renderText("Plot: ")
output$plot <- renderPlotly(p)
output$selected <- renderPrint({
d <- event_data("plotly_brushed")
if (!is.null(d)) {
saveRDS(d, "lassso_boundary.rds")
d
}
})
}
shinyApp(ui, server)
4. 在shiny页面圈选感兴趣的区域
在shiny页面,使用套索工具圈选感兴趣的区域,程序会自动将选区边界坐标导出到家目录中的lassso_boundary.rds文件中。
5. 读取套索选区,找到点坐标
lasso_boudnary <- readRDS("lassso_boundary.rds")
# find points
point_in_poly_idx <-
sp::point.in.polygon(
point


