例如,使用 Plotly Express 仅需一行代码即可完成动态 Choropleth 地图的创建。 与其他库相比,实现同样的效果可能需要编写大量的代码并尝试各种不同的解决方案。
结合 Dash (数据科学领域广泛使用且下载量最多的Web应用程序框架),Plotly提供了一整套用于部署 Web 应用程序的完整解决方案。 借助 Plotly Express 直观的 API 和 Dash Plotly,您可以将您的地理空间 Web 应用程序和可视化提升到一个新的水平。
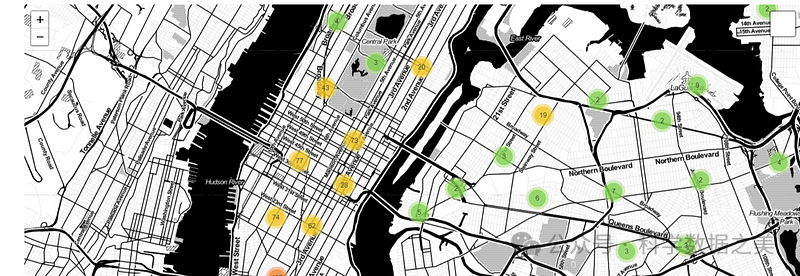
4. Folium
Folium 用于创建交互式 Web 地图,与 OpenStreetMap 和 Google Earth Engine (GEE) 配合良好。
 import folium

m = folium.Map(location=[0, 0], zoom_start=2)
folium.Marker(location=[-1.28, 36.82], popup="内罗毕, 肯尼亚").add_to(m)
GitHub 链接:
https://github.com/python-visualization/folium
官方网站:
https://python-visualization.github.io/folium/
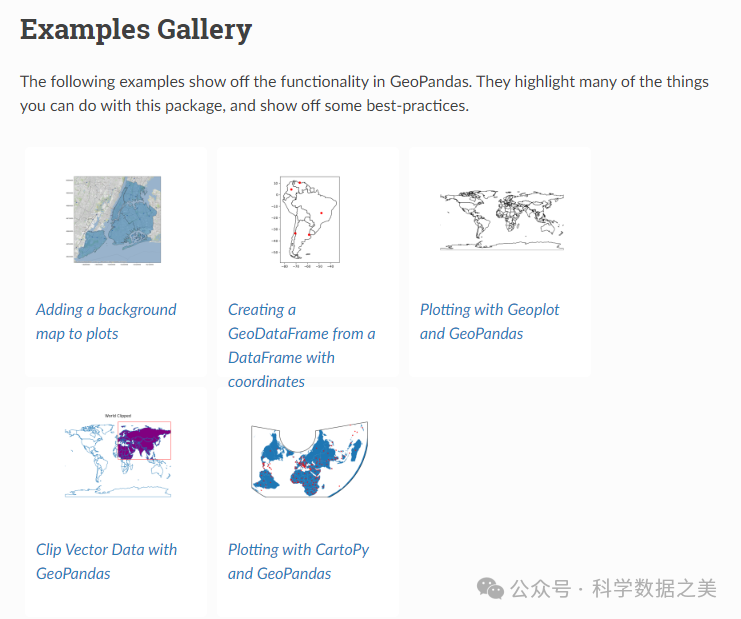
5. Geopandas
Geopandas 扩展了 Pandas,用于处理矢量数据(shapefile、GeoJSON),可用于将栅格数据与行政边界叠加显示。
 import geopandas as gpd
import matplotlib.pyplot as plt

gdf = gpd.read_file("boundaries.geojson")
gdf.plot(figsize=(10, 6), color="blue", edgecolor="black")
plt.show()
GitHub 链接:
https://github.com/geopandas/geopandas
官方网站:
https://geopandas.org/en/stable/
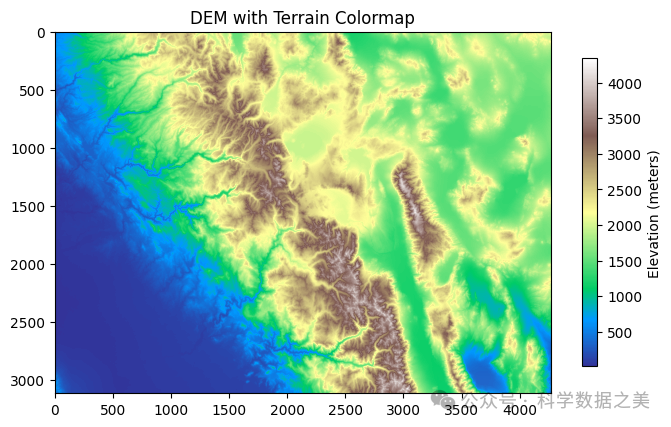
6. Rasterio
Rasterio 是读取和写入栅格数据集(TIFF、NetCDF)的关键库,用于裁剪、重投影和掩膜栅格数据。
import
rasterio
from rasterio.plot import show
with rasterio.open("satellite_image.tif") as src:
show(src)
GitHub 链接:
https://github.com/rasterio/rasterio
官方网站:
https://rasterio.readthedocs.io/en/stable/
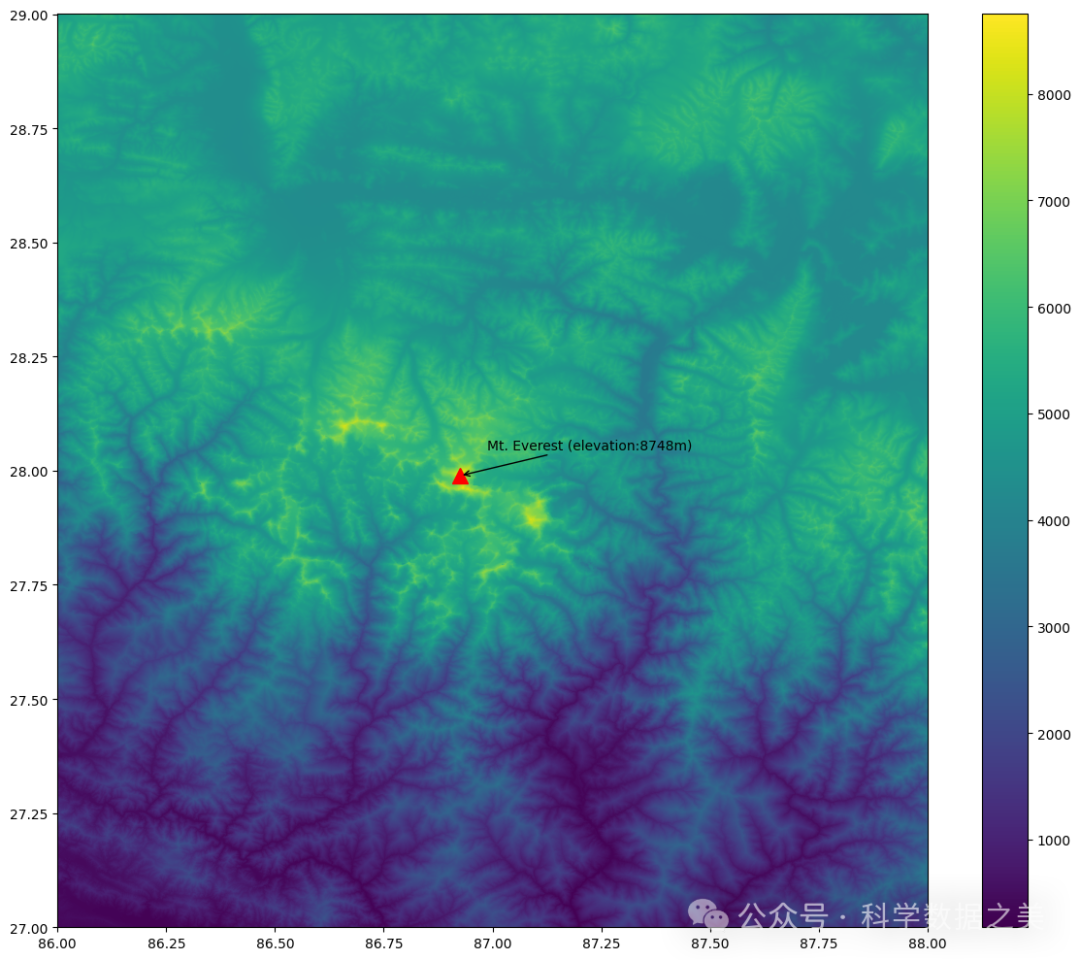
7. Xarray
Xarray 最适合处理大型、多维栅格数据集,常用于海洋、大气和遥感数据(NetCDF、HDF5)。
 import xarray as xr

dataset = xr.open_rasterio("satellite_image.tif")
dataset[0].plot()
GitHub 链接:
https://github.com/pydata/xarray
官方网站:
https://docs.xarray.dev/en/stable/
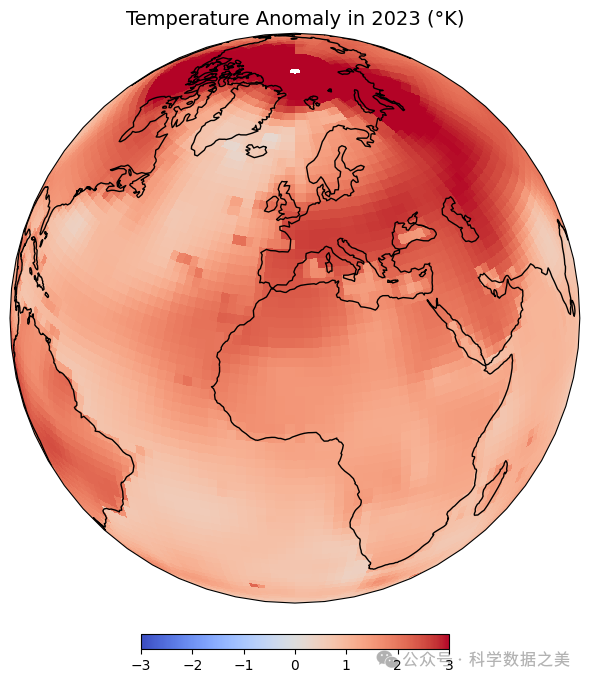
8. Cartopy
Cartopy 专门用于地图投影和地理空间可视化,支持shapefile、卫星影像叠加和网格变换。
 import cartopy.crs as ccrs
import cartopy.feature as cfeature
import matplotlib.pyplot as plt

fig, ax = plt.subplots(subplot_kw={'projection': ccrs.PlateCarree()})
ax.coastlines()
GitHub 链接:
https://github.com/SciTools/cartopy
官方网站:
https://scitools.org.uk/cartopy/docs/latest/
9. GDAL (地理空间数据抽象库)
GDAL是一个用于地理空间数据处理的基础库,支持处理栅格变换、格式转换和投影。
import cartopy.crs as ccrs
import cartopy.feature as cfeature
import matplotlib.pyplot as plt
fig, ax = plt.subplots(subplot_kw={'projection': ccrs.PlateCarree()})
ax.coastlines()
ax.add_feature(cfeature.BORDERS, linestyle=
':')
plt.show()
GitHub 链接:
https://github.com/OSGeo/gdal
官方网站:
https://gdal.org/
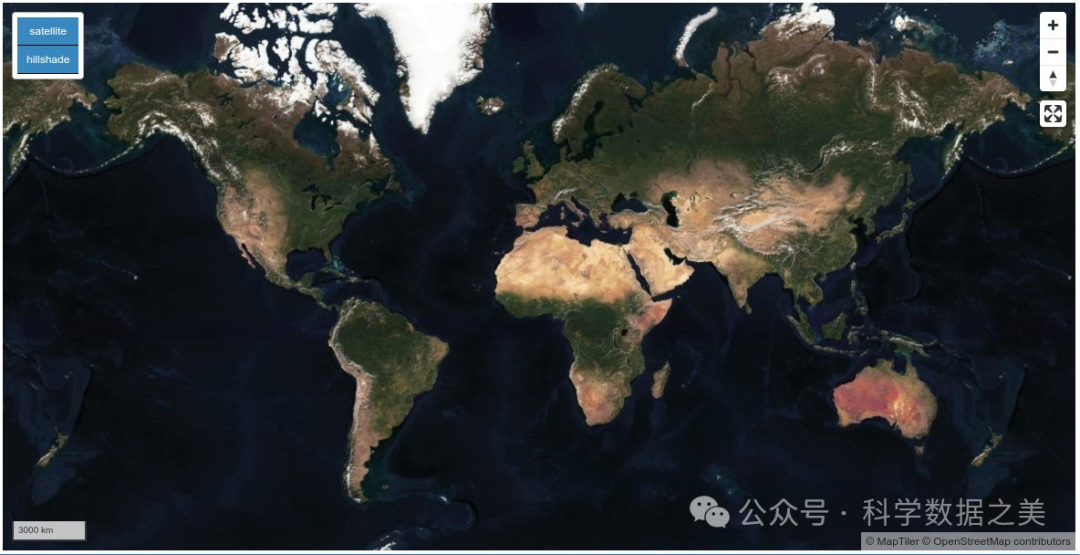
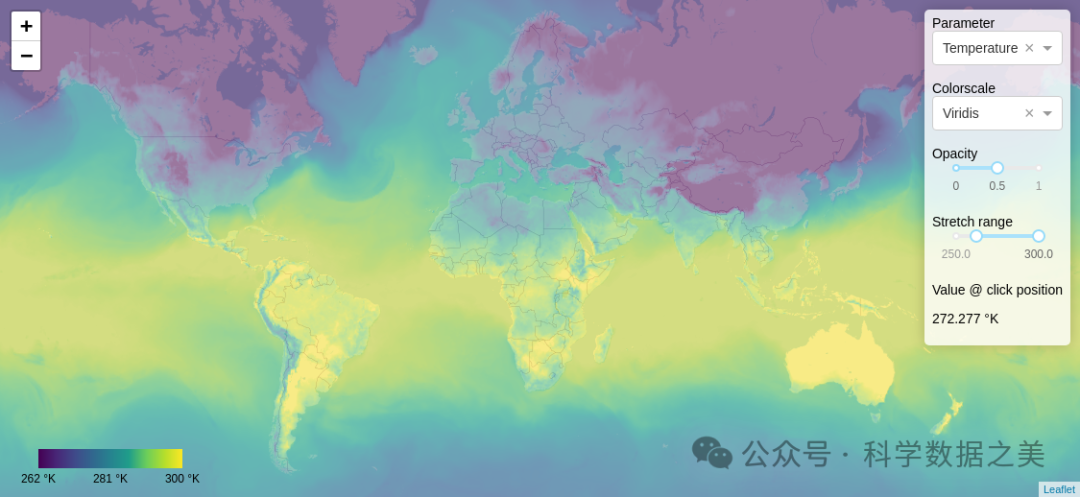
10. Leaflet (通过 ipyleaflet)
Leaflet类似于Folium,但在Jupyter notebook中更具可定制性,非常适合添加交互式标记、热图和叠加层。
 from ipyleaflet import Map, Marker

m = Map(center=(0, 0), zoom=2)
marker = Marker(location=(-1.28, 36.82))
m.add_layer(marker)
GitHub 链接:
https://github.com/jupyter-widgets/ipyleaflet
官方网站:
https://ipyleaflet.readthedocs.io/en/latest/
11. Bokeh
Bokeh 是一个高性能交互式可视化库,适用于基于 Web 的卫星影像可视化。
 from bokeh.plotting import figure, show
import numpy as np

img = np.random.rand(100, 100)
p = figure(width=500, height=500)
p.image(image=[img], x=0, y=0, dw=10, dh=10)
show(p)
GitHub链接:
https://github.com/bokeh/bokeh
官方网站:
https://bokeh.org/
12. OpenCV
OpenCV 主要用于图像处理,适用于卫星影像的边缘检测、分类和分割。
import cv2
img = cv2.imread("satellite_image.tif",
cv2.IMREAD_GRAYSCALE)
edges = cv2.Canny(img, 100, 200)
cv2.imshow("Edges", edges)
cv2.waitKey(0)
GitHub链接:
https://github.com/opencv/opencv
官方网站:
https://opencv.org/
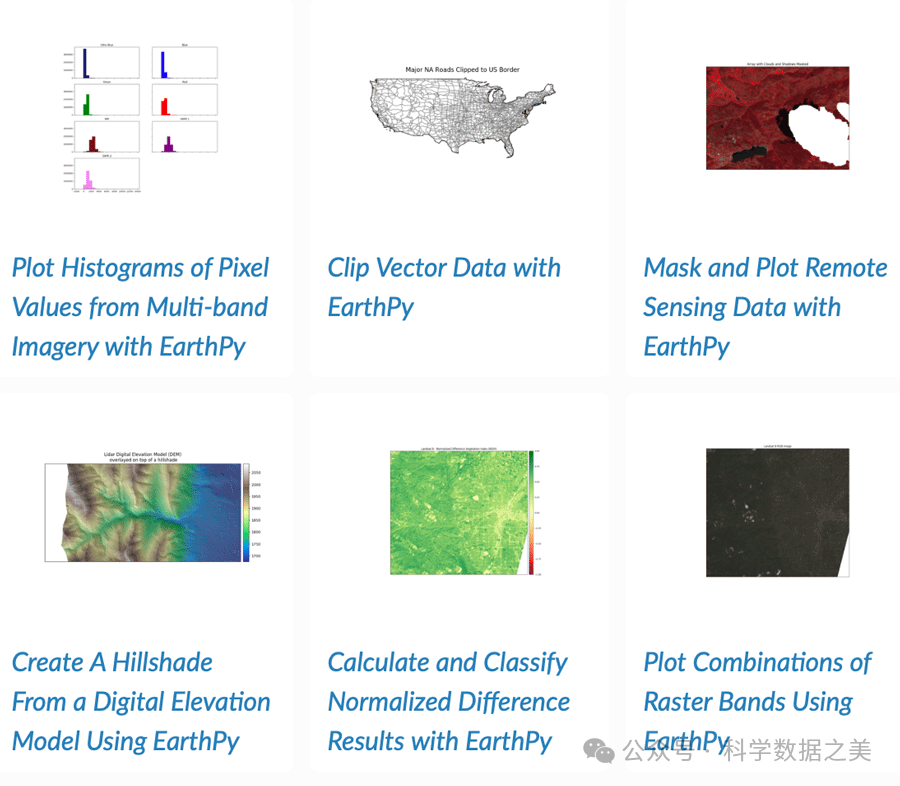
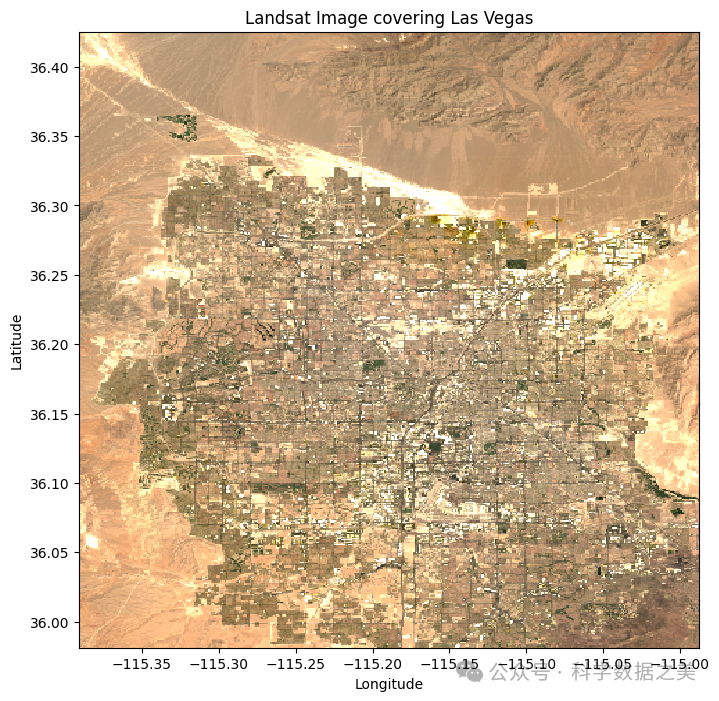
13. EarthPy
EarthPy 专为处理和可视化遥感数据而设计,适用于Landsat、Sentinel和MODIS数据处理和分析。
 import earthpy.plot as ep
import rasterio

with rasterio.open("satellite_image.tif") as src:
    ep.plot_rgb(src.read())
GitHub 链接:
https://github.com/earthlab/earthpy
官方网站:
https://earthpy.readthedocs.io/en/latest/
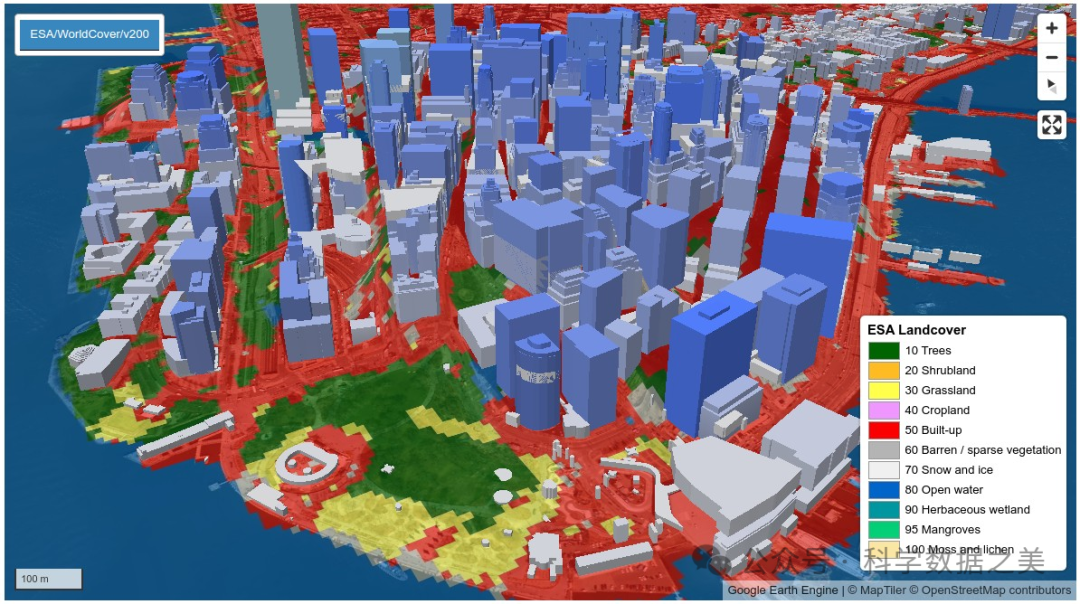
14. Pydeck
Pydeck 是一个用于大规模地理空间数据的 3D 可视化库,适用于可视化点云、高程模型和卫星影像。
 import earthpy.plot as ep
import rasterio

with rasterio.open("satellite_image.tif") as src:
    ep.plot_rgb(src.read())
请注意 Pydeck 实际上是
deck.gl
的 Python 封装,所以这里链接的是
deck.gl
的 GitHub 仓库和 Pydeck 的官方文档
GitHub 链接:
https://github.com/visgl/deck.gl
官方网站:
https://pydeck.gl/
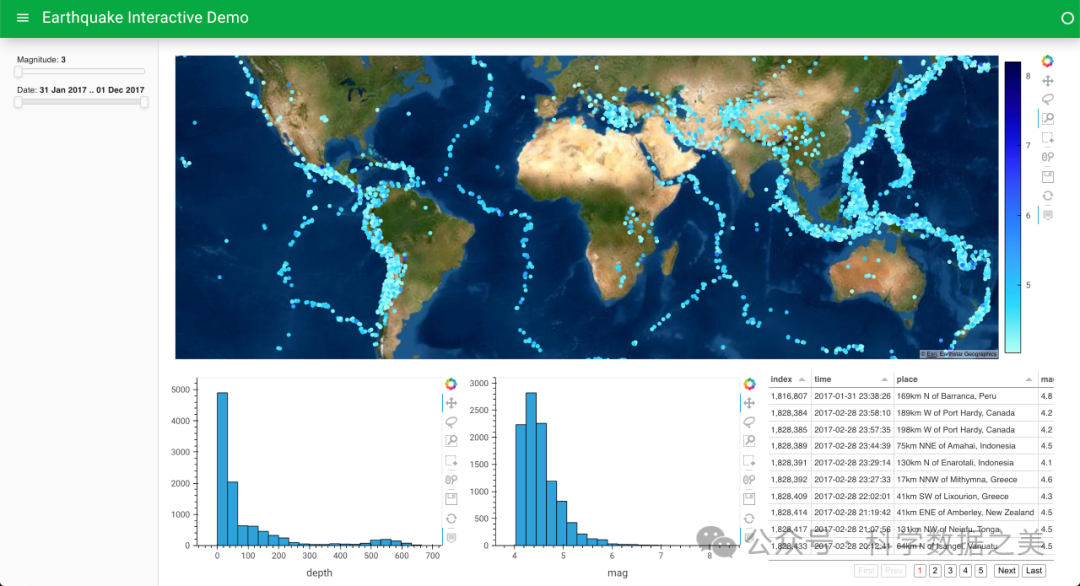
15. Kepler.gl
Kepler.gl 是一个强大的基于Web的地图可视化库,能够处理海量的地理空间数据集进行可视化。
 from keplergl import KeplerGl

map_1 = KeplerGl(height=500)
map_1
请注意 Kepler.gl 是一个 JavaScript 库,
keplergl-jupyter
是其 Python 封装, 这里链接的是
kepler.gl
的 GitHub 仓库和官方网站
GitHub 链接:
https://github.com/keplergl/kepler.gl
官方网站:
https://kepler.gl/
16. PySAL (Python 空间分析库)
PySAL 是一个用于空间统计和计量经济学的库,适用于检测遥感数据中的空间模式。
import numpy as np
import libpysal as ps
data = np.random.rand(100)
weights = ps.weights.lat2W(10, 10)
print(weights.neighbors)
GitHub 链接:
https://github.com/pysal/pysal
官方网站:
https://pysal.org/
17. Rioxarray
Rioxarray扩展了Xarray库,用于地理空间栅格操作,支持坐标参考系统 (CRS) 变换,并适用于NetCDF、GeoTIFF和HDF5文件。
 import rioxarray as rxr

raster = rxr.open_rasterio("satellite_image.tif")
raster.rio.reproject("EPSG:4326").plot()
GitHub 链接:
https://github.com/corteva/rioxarray
官方网站:
https://corteva.github.io/rioxarray/stable/
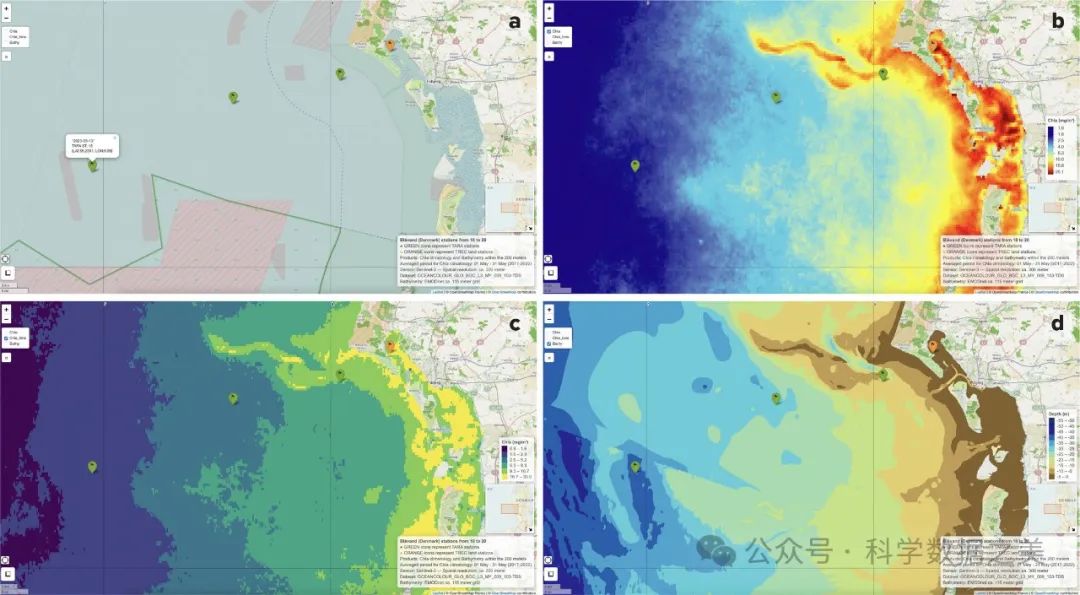
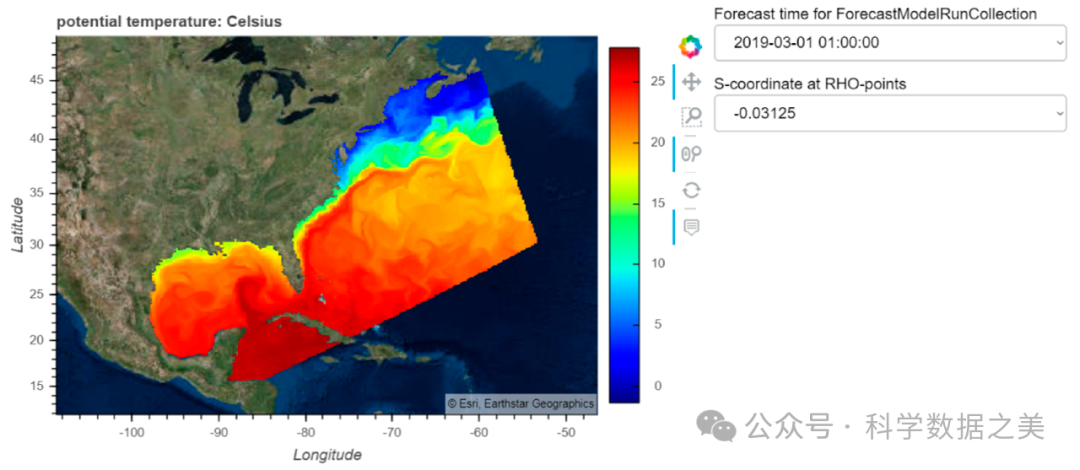
18. Holoviews + Geoviews
Holoviews 和 Geoviews 简化了交互式地理空间可视化,与 Bokeh、Matplotlib 和 Plotly 协同工作。
这里同时提供了 Holoviews 和 Geoviews 的链接,因为它们通常一起使用
 import geoviews as gv
from geoviews import opts
import cartopy.crs as ccrs

gv.extension('bokeh')
world = gv.feature.land.opts(projection=ccrs.PlateCarree())
world
Holoviews GitHub 链接:
https://github.com/holoviz/holoviews
Holoviews 官方网站:
https://holoviews.org/
Geoviews GitHub 链接:
https://github.com/holoviz/geoviews
Geoviews 官方网站:
https://geoviews.org/
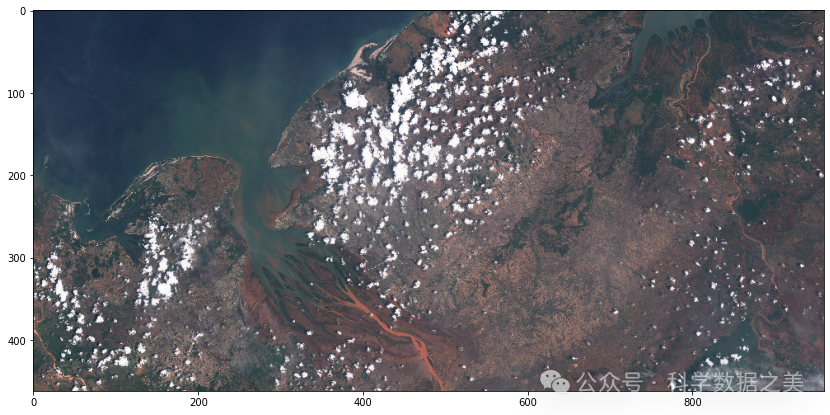
19. SentinelHub-Py
SentinelHub-Py 可以直接访问 Sentinel-2、Sentinel-1 和 Landsat 影像,支持云层过滤、镶嵌和可视化,非常适合近实时遥感应用。
from sentinelhub import BBox, CRS
bbox =
BBox(bbox=(-5.0, 40.0, 5.0, 50.0), crs=CRS.WGS84)
print(bbox)
GitHub 链接:
https://github.com/sentinelhub/sentinelhub-py
官方网站:
https://sentinelhub-py.readthedocs.io/en/latest/
20. Terracotta
Terracotta 是一个轻量级的栅格数据瓦片服务器,适用于将卫星影像作为 Web 地图服务,并与 SQLite 数据库配合进行元数据存储。
terracotta serve --port 5000
GitHub 链接:
https://github.com/DHI-GRAS/terracotta
官方网站:
https://terracotta.readthedocs.io/en/latest/
总结
这20个Python工具库涵盖了从简单的数据可视化到交互式在线地图,再到处理海量卫星数据的各种应用场景。 这些技术为地理空间分析工作奠定了坚实的基础,无论是处理原始卫星影像、进行复杂的空间分析,还是使用AI/ML进行预测性分析。
从管理多维栅格数据集 (Xarray, Rioxarray) 到生成适合出版的地图 (Cartopy, Folium),再到访问实时地球观测数据 (SentinelHub-Py, EarthPy),每个库都有其自身的特点。 借助Dask、Rasterio和GDAL等库,可以高效地处理大型数据集,尤其是在需要高性能计算的情况下。
通过组合使用这些工具,用户可以:
-
预处理和清理卫星影像
(Rasterio, GDAL, Pyresample)
-
执行统计和地统计分析
(PySAL, Geopandas)
-
创建美观的交互式地图
(Folium, H3-Py, Holoviews, Geoviews)
-
从遥感数据中提取有价值的洞察
(EOReader, Satpy, EarthPy)
-
开发可扩展的云端应用
(Terracotta, Kepler.gl, Google Earth Engine API)
随着卫星影像变得越来越容易获取,以及人工智能驱动的地理空间分析不断发展,Python仍然是地理空间专业人员的首选语言。


