当我们在图形中添加标签时,标签之间很容易相互重叠,包
ggrepel
就专门用来解决这个问题! 首先我们来看看通过geom_text()添加标签时的情形:
library(ggplot2)
#使用数据集mtcars演示
ggplot(mtcars)+ geom_point(aes(wt, mpg), color="red")+
geom_text(aes(wt, mpg, label=rownames(mtcars)))+
theme_classic(base_size = 16)
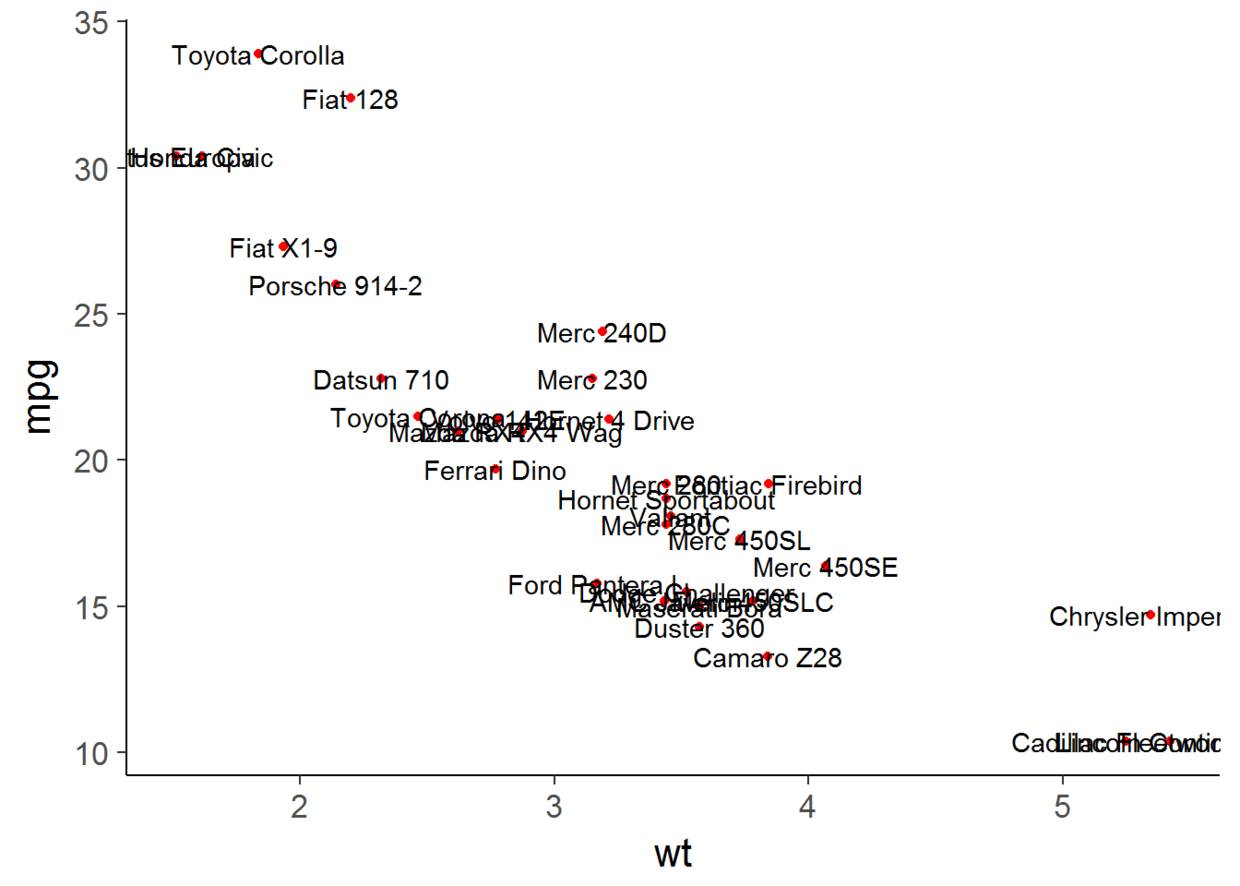
可以看到可视化效果不是很好。接下来看看包
ggrepel
的效果。
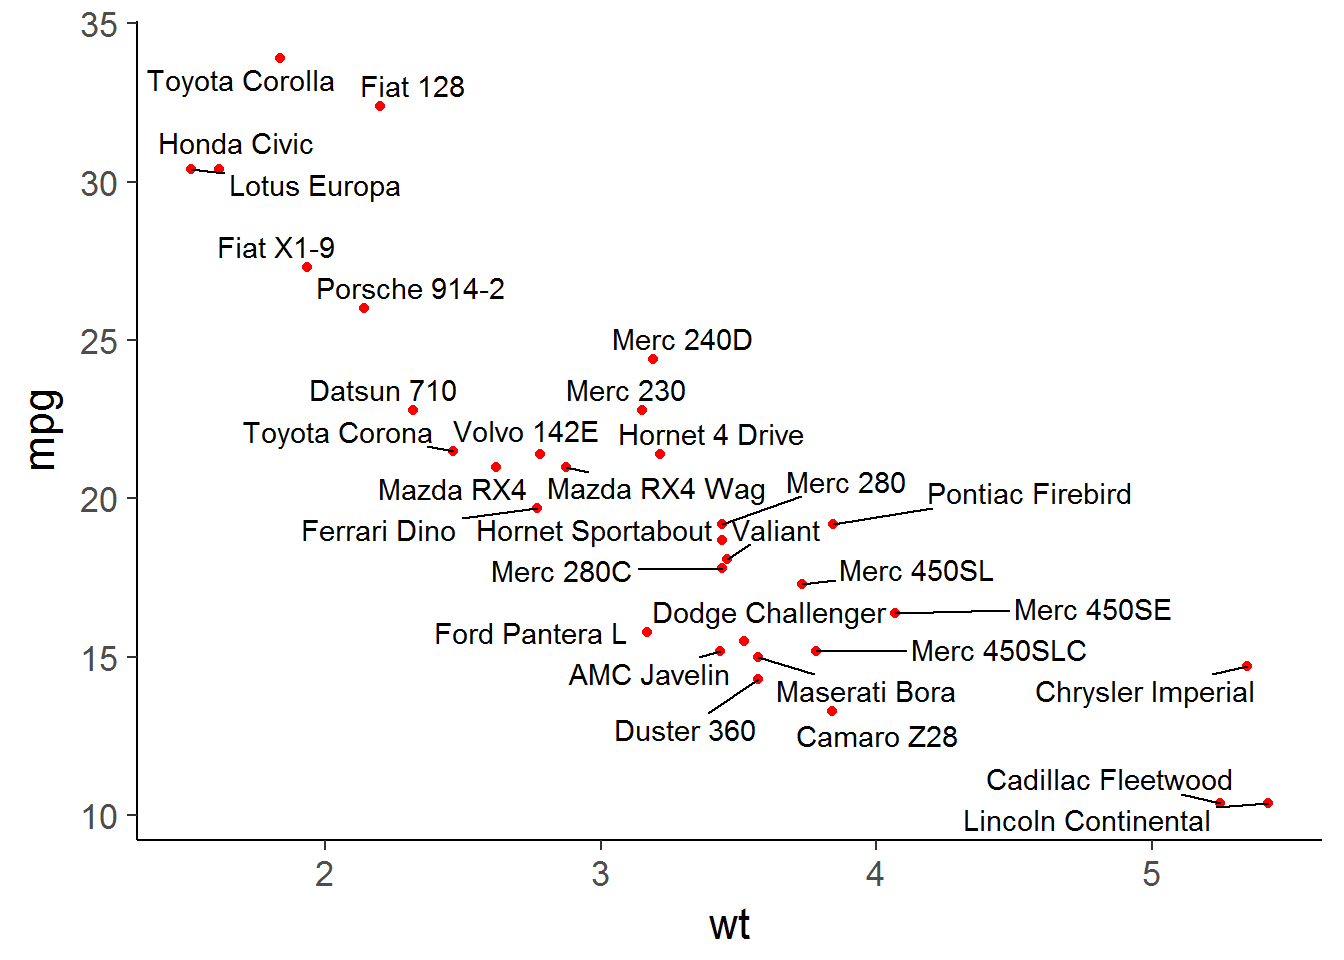
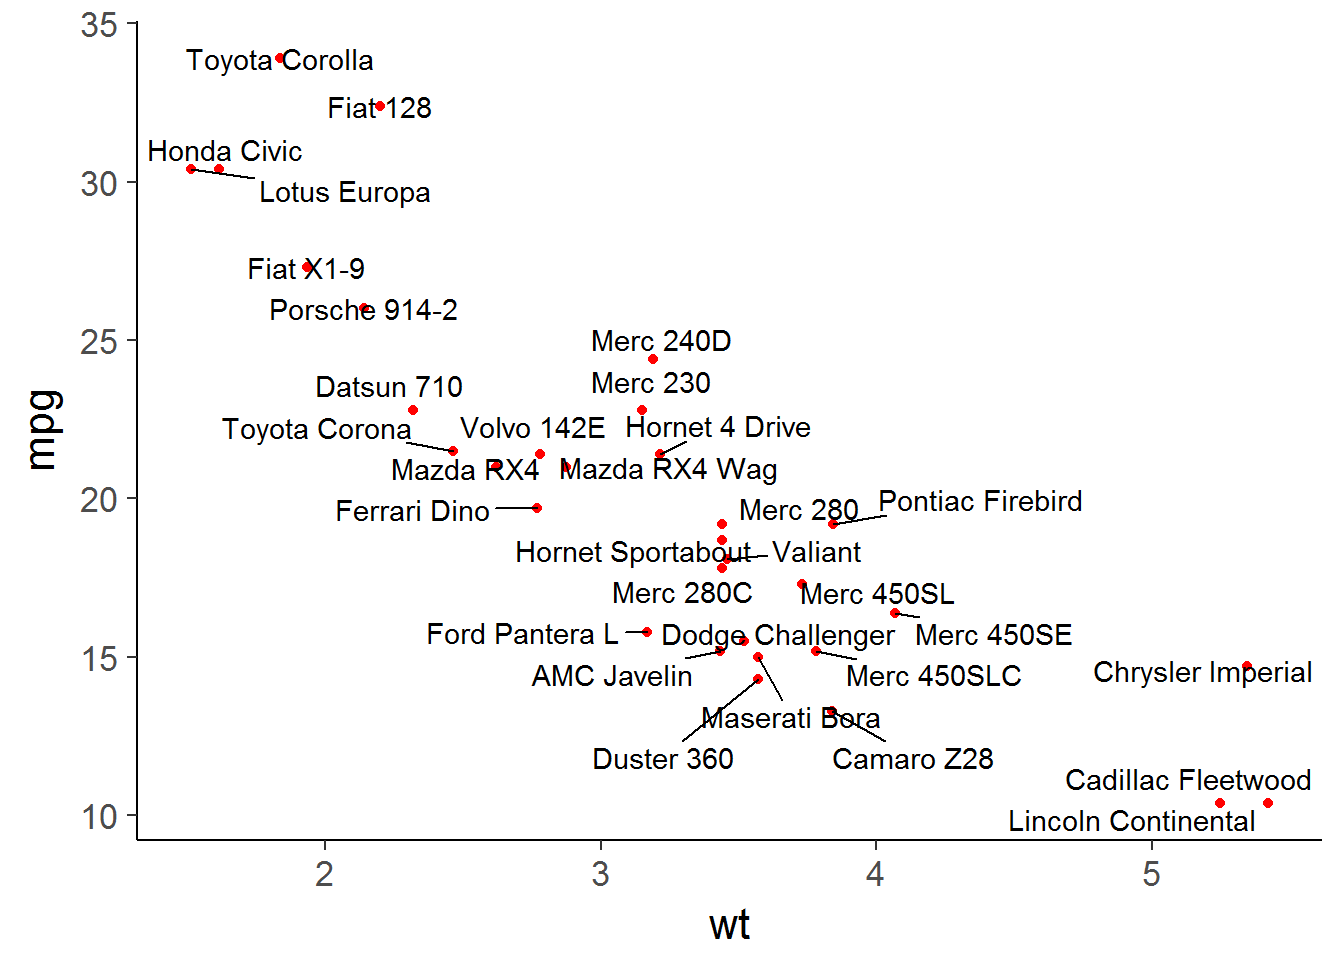
#geom_text_repel()
geom_text_repel()是基于geom_text()
library(ggrepel)
set.seed(42)
ggplot(mtcars)+ geom_point(aes(wt, mpg), color="red")+
geom_text_repel(aes(wt, mpg, label=rownames(mtcars)))+
theme_classic(base_size = 16)
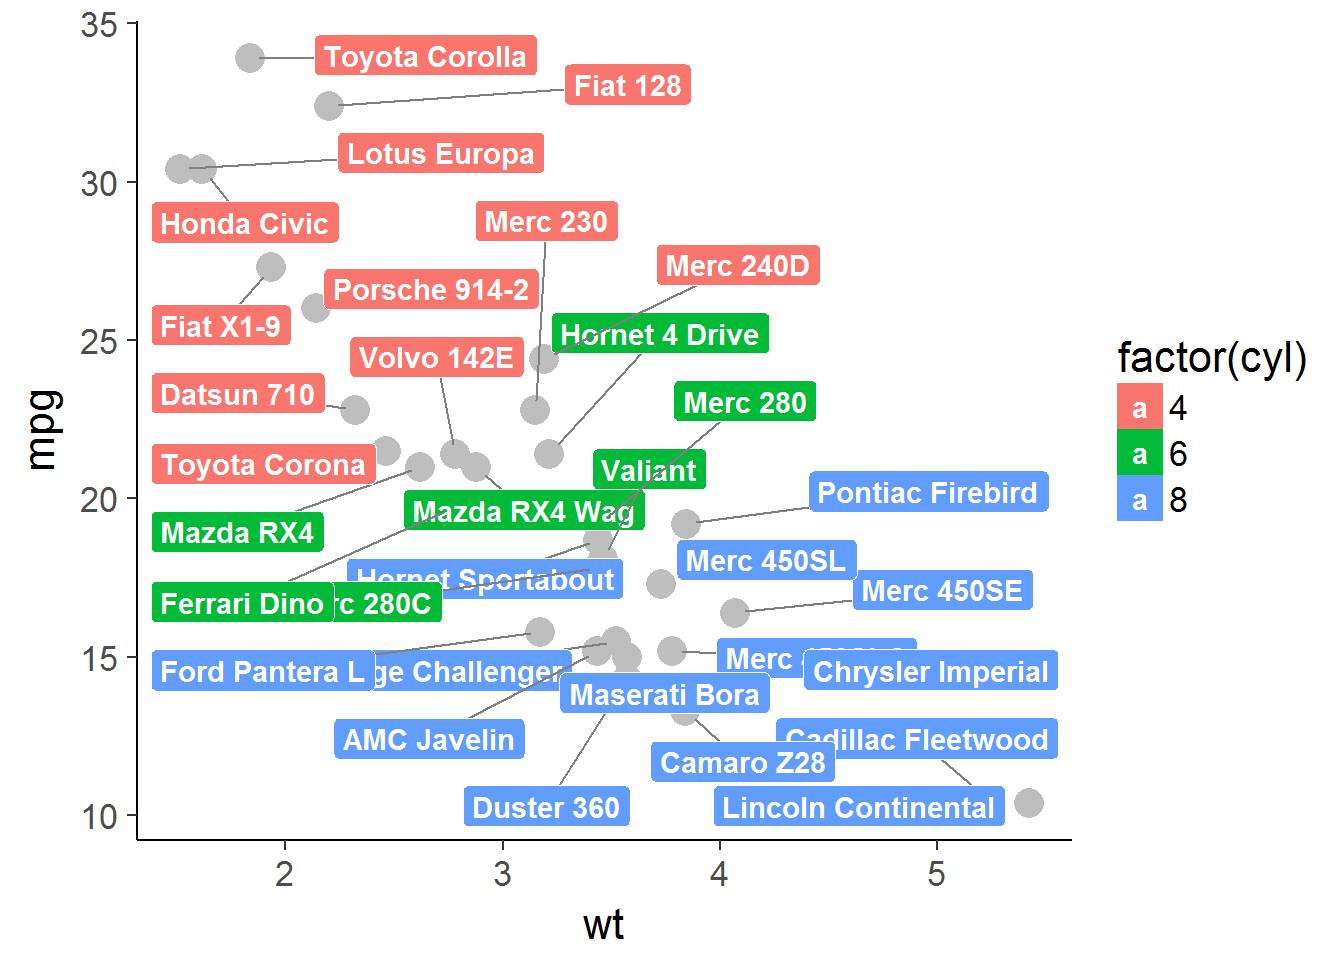
geom_label_repel()
geom_label_repel()是基于geom_label(),它将标签置于一个小方框中
set.seed(42)
ggplot(mtcars)+ geom_point(aes(wt, mpg), color="grey", size=5)+
geom_label_repel(aes(wt, mpg, fill=factor(cyl),
label=rownames(mtcars)), fontface="bold", color="white",
box.padding=unit(0.35, "lines"), point.padding=unit(0.5, "lines"),
segment.colour = "grey50")+ theme_classic(base_size = 16)
参数
大部分
geom_text()
的参数都适用于
geom_text_repel()
,除了以下几个:
-
hjust
-
vjust
-
position
-
check_overlap
ggrepel
包为
geom_text_repel()
与
geom_label_repel()
提供了特有的参数设置:
-
segment.color:连接点与标签的线段的颜色
-
segment.size:线段的粗细
-
segment.alpha:线段的透明度
-
box.padding:文本框周边填充
-
point.padding:点周围填充
-
arrow:grid:arrow提供的箭头
-
force:强制性将重叠文本散开
-
max.oter:最大迭代次数
-
nudge_x/y:标签开始位置在坐标轴的移动距离
-
direction:允许标签的方向,x、y or both
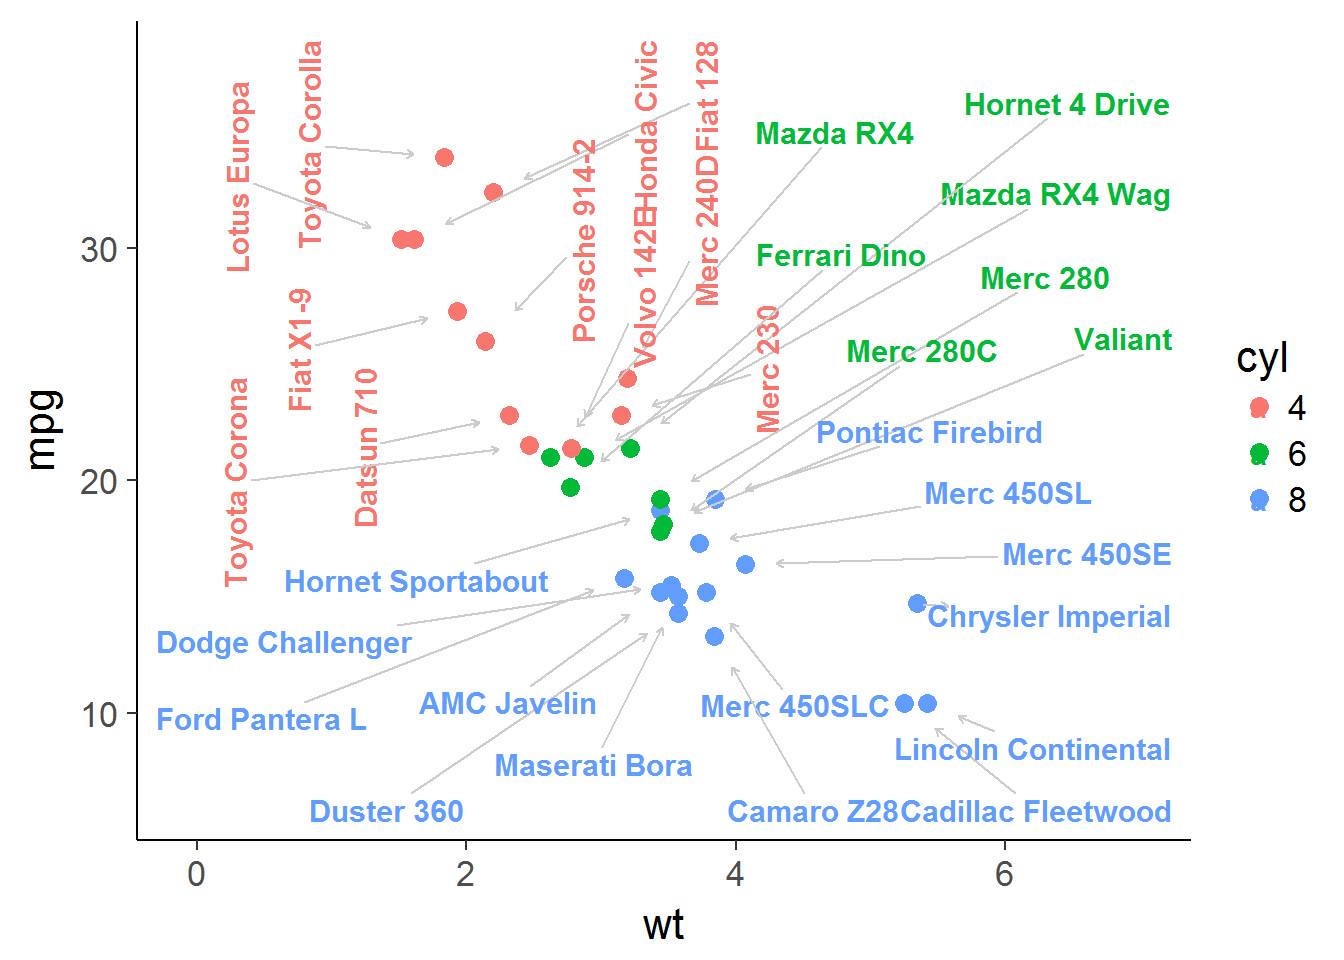
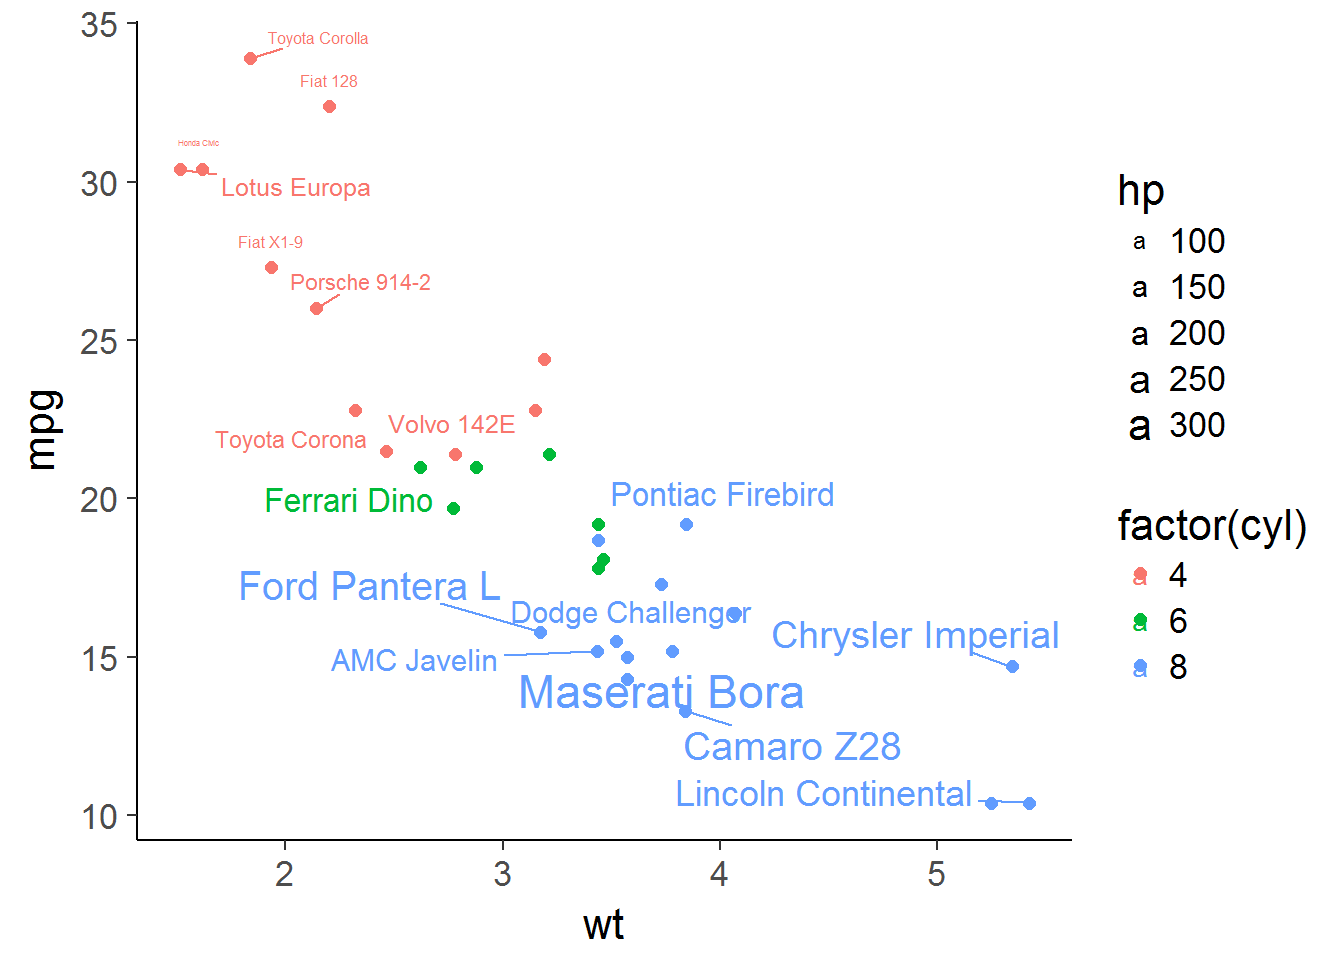
下面举个栗子来详细了解这些参数的图形效果
set.seed(42)
ggplot(mtcars)+ geom_point(aes(wt, mpg, color=factor(cyl)), size=3)+
geom_text_repel(aes(wt, mpg, color=factor(cyl),
label=rownames(mtcars), angle=ifelse(mtcars$cyl==4, 90, 0)),
size=4, family="Times", fontface="bold",
box.padding=unit(0.5, "lines"), point.padding=unit(1.6, "lines"),
segment.color = "#cccccc", segment.size = 0.5,
arrow = arrow(length=unit(0.01, "npc")),force = 1, max.iter = 3e3,
nudge_x = ifelse(mtcars$cyl==6, 2, 0), nudge_y = ifelse(mtcars$cyl==6, 9, 0))+
scale_color_discrete(name="cyl")+
scale_x_continuous(expand = c(0.5, 0))+
scale_y_continuous(expand = c(0.25, 0))+
theme_classic(base_size = 16)
也可以通过设置参数
point.padding=NA
不对点进行
repel
set.seed(42)
mtcars$label
通过赋值某些
label
空字符“”来隐藏。
set.seed(42)
mtcars$label
将标签控制在特定区域
通过设置参数xlim和ylim来限制label的位置
set.seed(42)
data =mu, ]
ggplot()+ geom_vline(xintercept = mu)+
geom_point(aes(wt, mpg), data=data)+
geom_text_repel(data=left, aes(wt, mpg, label=rownames(left),
color="Left half"), xlim=c(NA, mu))+
geom_text_repel(data=right, aes(wt, mpg, label=rownames(right),
color="Rigth half"), xlim=c(mu, NA))+ theme_classic(base_size = 16)

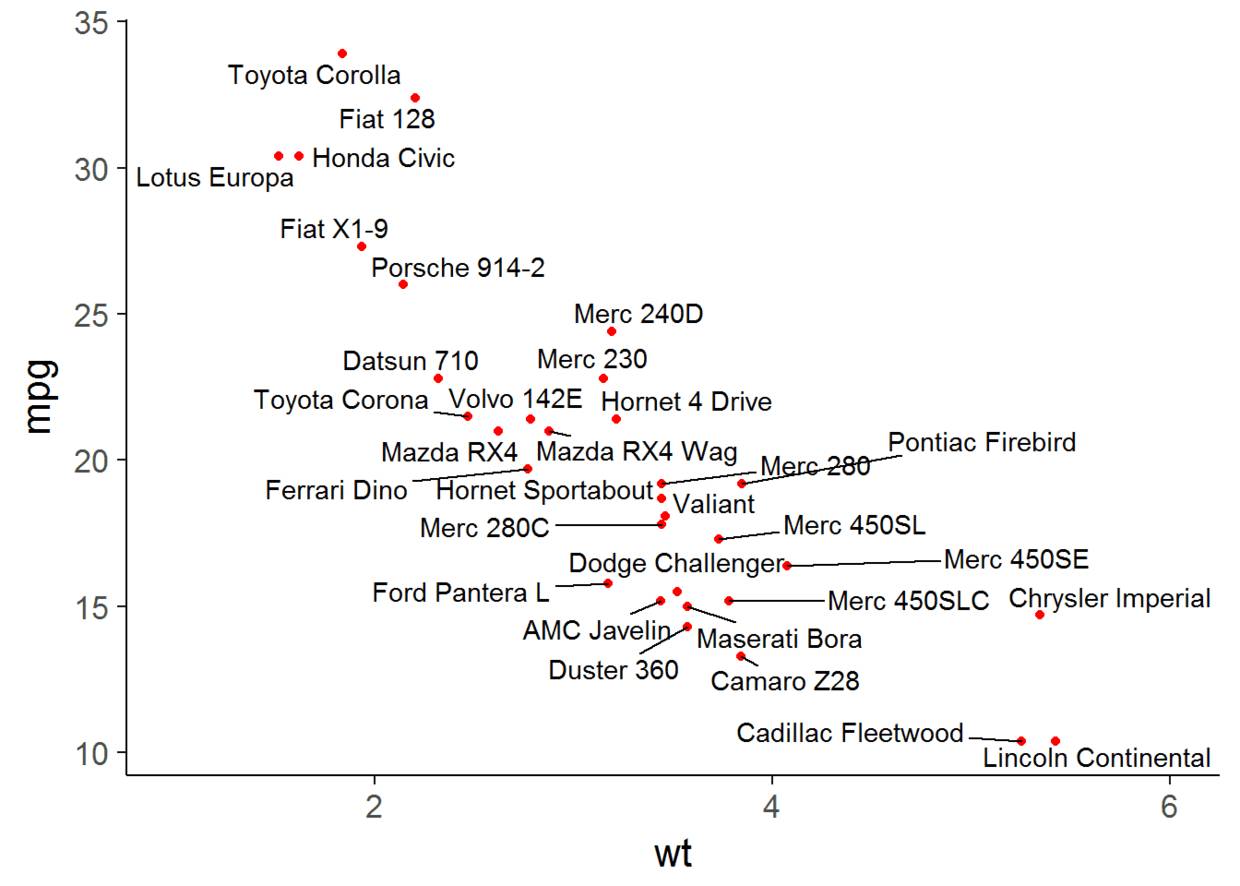
通过控制参数direction来决定label是左右移动还是上下移动, 默认是both
set.seed(42)
#direction="x" 左右移动
ggplot(mtcars)+
  geom_point(aes(wt, mpg), color="red")+
  geom_text_repel(aes(wt, mpg, label=rownames(mtcars)), direction="x")+
  theme_classic(base_size = 16)+xlim(1, 6)
#direction="x" 上下移动
ggplot(mtcars)+
  geom_point(aes(wt, mpg), color="red")+
  geom_text_repel(aes(wt, mpg, label=rownames(mtcars)), direction="y")+
  theme_classic(base_size = 16)+xlim(1, 6)