
概要
史诗级的货币和信贷增长显示重振经济的决心。
当前,中国重振经济的决心已经跃然纸上。
短期票据融资激增反而可能成为近期市场投机活动的一个流动性来源。
尽管中国央行可能不得不在稍后阶段重新平衡3月天量的货币增长,但这些货币统计数据显示出的决心也印证了稳定经济的重要性。
很难想象有谁会愿意把刚刚复苏的经济扼杀在萌芽状态。
大规模的流动性供应迟早会转化为基本面的进一步好转。
近期的经济数据验证了我们之前对经济周期在2019年复苏的预测,但周期性板块并没有完全参与市场周期性的复苏 – 周期性板块应该很快将跑赢市场。
房地产建设投资的增长,地方政府债券发行激增所暗示的、即将开启的基建投资,以及重新显示经济扩张的PMI,都表明中国经济出现了周期性复苏。
奇怪的是,周期性行业并没有完全参与当前的市场的周期性修复。
许多周期性行业的盈利预期正从去年12月底的低点回升,但相对于许多防御性板块盈利预期修复的水平仍有一定的距离。
这种情况与过去几个周期性拐点的观察结果一致。
当时,随着经济复苏的蔓延,周期性板块接力防御性板块的市场领先地位。
这次也不会有什么不同。
周期的运行周而复始,并没有开始,也没有结束。
周期性板块到此时的相对表现疲弱,表明了一个被忽略投资机会。
市场对复苏仍然持怀疑态度,预示着市场未来还有高点。
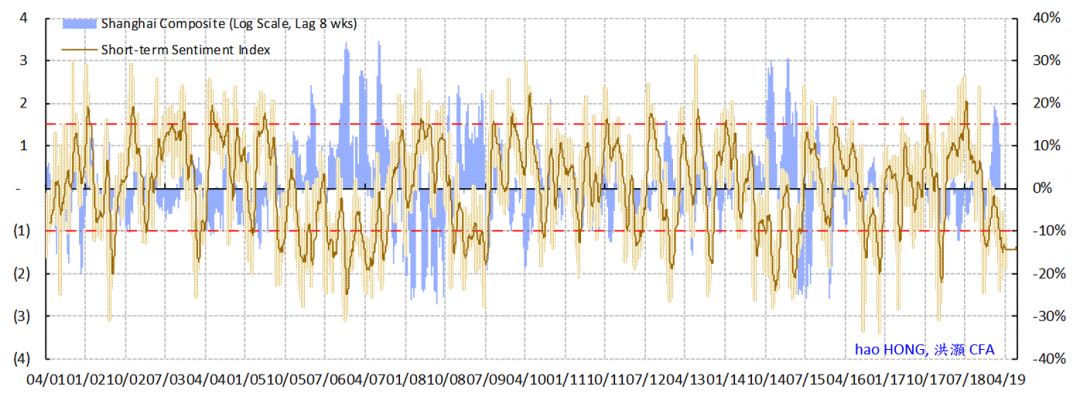
我们自主研发的市场情绪模型显示,人们对当前的复苏抱有根深蒂固的怀疑。
即将到来的基本面改善将打消这些疑虑,把空头变成多头。
随着史诗级的货币数据出炉,市场将开始寻找,并应很快就会找到周期性复苏的确凿证据。
这是因为基本面的改善往往会在强劲的流动性增长后随之而来,并将建立一个良性的市场价格和基本面之间的反馈循环。
因此,市场普遍的谨慎反而暗示市场将进一步上涨。
我们再次强调,此刻,长期上升趋势重于短期波动。
美元不再走强有利于新兴市场和A股。
贸易加权的美元汇率目前运行到一个历史上无法逾越的高点——上一次是在2016年12月特朗普赢得大选后。
美联储暂停加息,以及中国倾向于货币宽松政策而引领的经济周期复苏,很可能会抑制美元的强势。
美元的强势一般反映了美元流动性正在下降。
这种情景对新兴市场和A股都是不利的影响 – 如2018年。
现在,情况肯定正好相反。
我们上一份报告论述了A股的回报率更多是估值倍数扩张的结果,而非盈利增长。
在大规模的货币扩张和经济周期性复苏的背景下,要同时从这两个因素中获得最大的收益,我们应该在盈利预期有最大的、向上修正空间的周期性行业中进行配置。
由4万亿刺激计划引发的2009年股票市场复苏持续了10个月。
其后,虽然市场止步不前,经济继续复苏。
我们现在距离1月初市场触底已有四个月。
这是我们20190414的报告《
洪灝:
经济周期确认了一个重要的拐点
》的英文原版。感谢阅读。
----------------------------------------
Epic money and credit growth suggests resolve to reflate the economy.
There should be no more doubt by now about the central bank’s resolve to reflate the economy. Surging short-term bills financing can be a source of speculative market activities in the near term. While the PBoC may have to rebalance the epic monetary growth in March at a later stage, the resolve demonstrated by this set of monetary statistics also suggests the equal importance of not rocking the boat and nipping the nascent recovery in the bud. Epic liquidity flow will turn into better fundamentals sooner or later.
Recent data confirm the cyclical upturn we foresaw, but cyclicals have not participated in the cyclical revival – cyclicals should soon outperform.
Property construction spending growth and the coming infrastructure spending hinted by the surge in local government bond issuance, as well as the re-expanding PMI, all suggest a cyclical revival. Oddly, the cyclical sectors have not participated in full in the current cyclical upturn.
Earnings revision in many cyclical sectors is rising from its lows seen in late December, but not to the extent of that of their defensive comrades. This is consistent with the observations in the past cyclical inflection points, when defensives passed the market leadership onto cyclicals as the recovery spread. This time will not be different. The weak relative performance of cyclicals suggests overlooked investment opportunities.
Market remains skeptical of the recovery, auguring well for further gains ahead.
Our proprietary market sentiment model suggests entrenched skepticism towards the current recovery. The impending fundamental improvements will convert bears into bulls. With the epic monetary data in the bag, the market will start to look for, and soon should have confirming evidence of a cyclical recovery, as fundamentals tend to ensue after strong liquidity growth. A virtuous feedback loop will be established. As such, the prevailing caution in the market hints at further upside in the market. We reiterate that, at this juncture, the long-term rising trend trumps short-term fluctuations.
The peaking dollar a tailwind for EMs and A shares.
The trade-weighted dollar is at its highs which it was unable to scale in the past – last time it was December 2016 after Trump’s election victory. A pausing Fed and a PBoC with easing bias are likely to check the dollar strength. The strong dollar suggests dwindling dollar liquidity, and had been a headwind for EMs and A shares. Now the reverse must be true.
As we have demonstrated, the return in A shares is more the result of valuation multiple expansion than earnings growth. But to gain most from both factors amid epic monetary expansion and a cyclical revival, we should position in the cyclical sectors with the greatest room for upward earnings revision. The market recovery in 2009 induced by the 4-trillion-yuan stimulus lasted ten months. And the economic revival continued after that. It is now four months since the market bottomed in early January.
Cyclical Inflection Point is Confirmed
“The importance of money flows from it being a link between the present and the future.” – John Maynard Keynes
China’s monetary statistics have shown the policy preference of the PBoC. By now, there should not be any doubt about the central bank’s resolve to reflate the battered economy from an array of mishaps and missteps in 2018 – the trade war, overarching deleveraging campaign and supply-side curbs that had started to self-inflict. With progress being made on all three fronts, we continue to believe that, for the market, the long-term upward trend is more important than any short-term fluctuations.
That said, there are some incongruities in the recent data release. For instance, import growth appears weak and below expectations, and suggests sluggish domestic demand – contrary to the strong monetary data. Of the lending statistics, long-term demand for loans from both companies and households has yet to recover in full. Bank bills and notes financing, as well as short-term lending, are used to compensate the demand shortfall for loans. The accelerated issuance of local government bonds and the deployment of fiscal deposits have bulked up the money supply statistics.
To the stock market speculators, these inconsistencies are less pertinent than the grandeur of new loans and total social financing – both at their historic highs. While the structure of the monetary data could have been better, the freshly-injected liquidity will help the economy to reflate. And short-term bank bills and lending are more prone to be applied to speculative market activities – similar to 2009 and 2015.
A Missing Piece in This Rally
Cyclical inflection point is confirmed.
Since 2017, we have done extensive quantitative research into short economic cycles, both in the US and in China. Our models have clearly identified the existence of 3 to 3.5-year cycles in these economies. These short cycles ebb and flow with regularity, as evidenced by the similarity and simultaneity of fluctuations across various macroeconomic variables and across countries. The cycles seem to be fluctuating rhythmically around an underlying trend. Deviation from general rules that prevail in the sequence of the cycles is very rare.
Even when there is deviation from the underlying trend, such deviation tends to accelerate or retard its own momentum, rather than that of the underlying trends. The absence of such deviation and the simultaneity of the fluctuations across an array of macroeconomic variables are a remarkable proof of the cycle’s existence.
In our 2019 outlook report “
Turning a Corner
”, and its follow-up report “
Turning a Corner:
Teachings from the Year of the Dog
”, we foresaw the turning of China’s short economic cycle in 2019, and the potential recovery of risk asset prices. The challenge then when making this call was to estimate how strong the recovery in asset prices could be, and the contingencies of the trade war. In hindsight, our estimate that the Shanghai Composite should climb above 2,900 when the index was still lingering around 2,500 has proven to be grossly conservative.
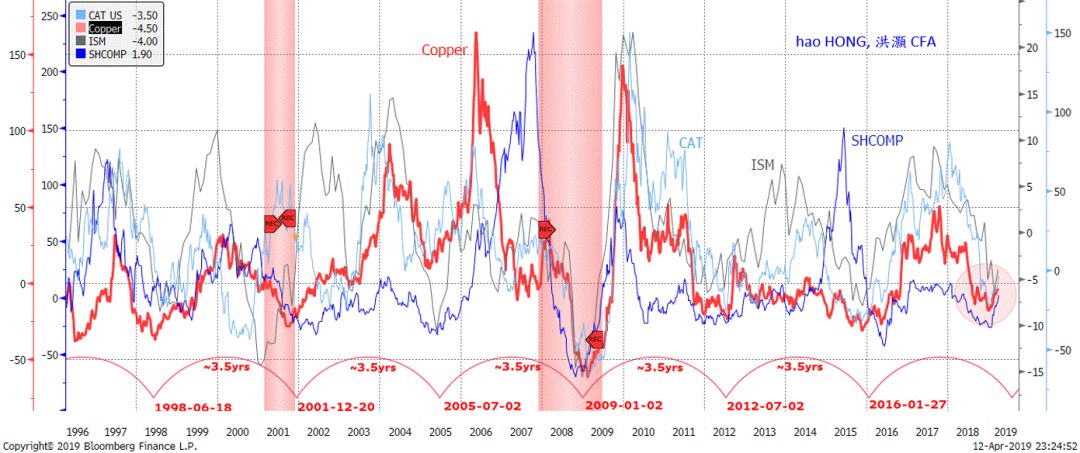
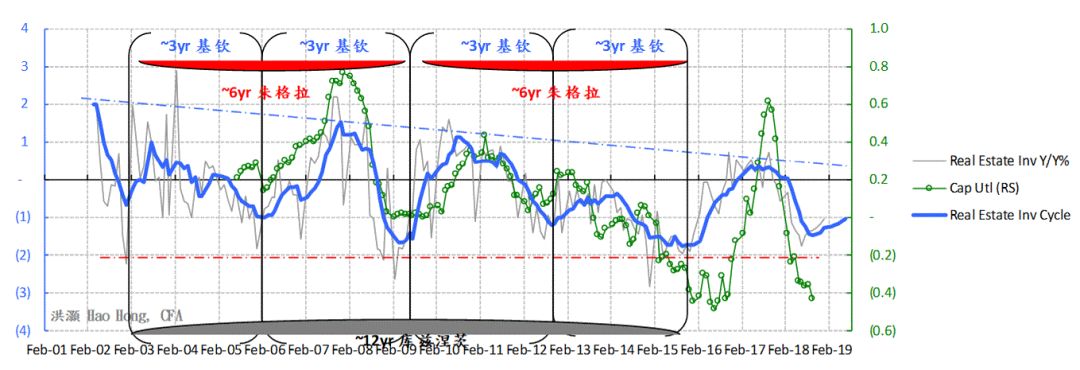
With strong recovery in property construction spending and the coming infrastructure spending hinted by the increase in local government bond issuance, our economic cycle model has shown a decisive upturn in China’s 3-year economic cycle. More importantly, our cycle models for other risk assets that have exhibited consistent property to lead economic activities, such as copper, are also turning up.
Interestingly, the interval of the copper cycle is also about 3 to 3.5 years, coinciding with the length of China’s economic cycle and its key inflection points in the past. In
Figure 1 – 3
, we show that the revival in the copper cycle, together with other growth-sensitive asset prices, validates the reflation in China’s 3-year economic cycle.
Figure 1:
Copper’s 3~3.5 year cycle is recovering, and is confirmed by other leading indicators
Source: Bloomberg, BOCOM Int'l
Figure 2:
China’s economic cycle is reviving, and so are asset prices (commodities/bonds/currency)
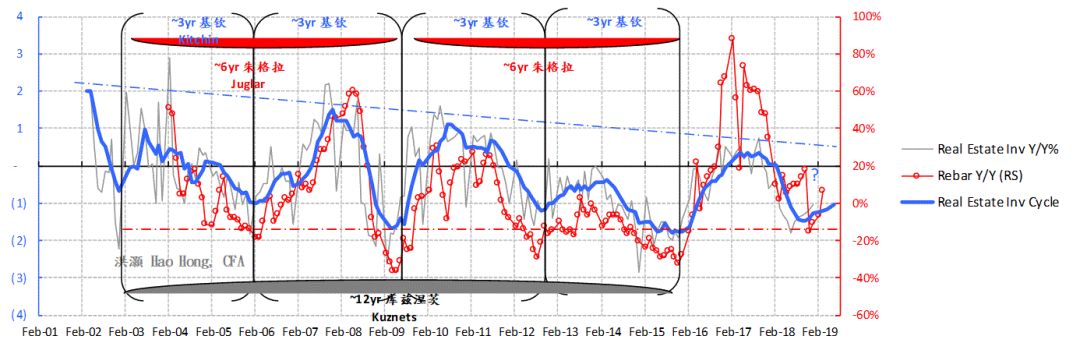
Source:
Bloomberg, BOCOM Int'l
Note:
Property construction, part of overall completed property investment that also includes land purchase, is more closely correlated with economic activities. Due to the irregularities of the data release since 2017, we have used the construction data series to calculate the property investment cycle. Only selected cyclical charts are shown here. For complete detailed discussions on China’s 3-year short economic cycle, please refer to your reports titled “
A Definitive Guide to China’s Economic Cycles
” (20170324) and “
A Definitive Guide to China’s Economic Cycles II – New High”
(20170828).
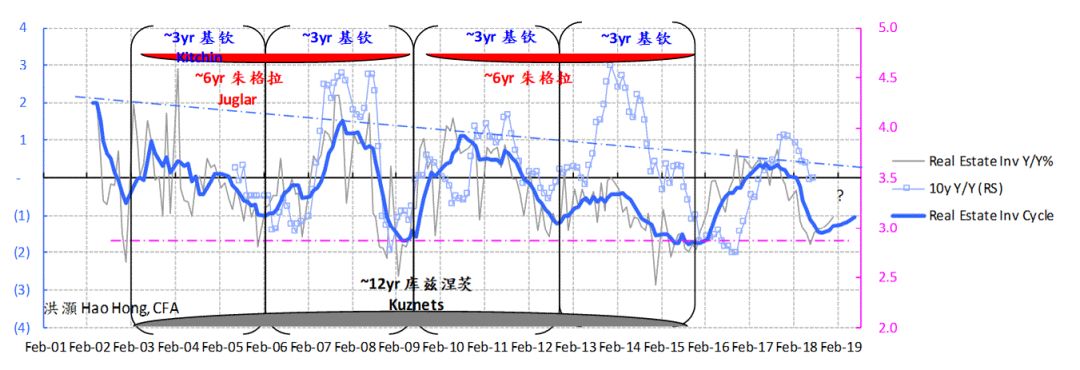
Figure 3:
China’s economic cycle is reviving, as evidenced by the PBoC’s balance sheet, M1 and earnings
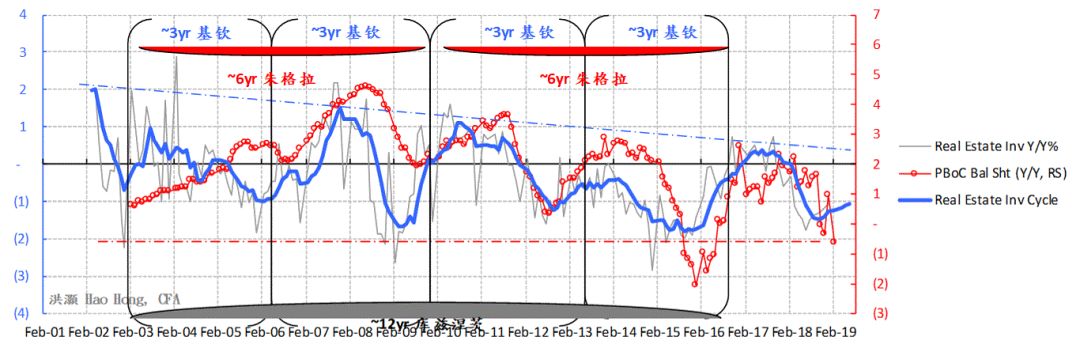
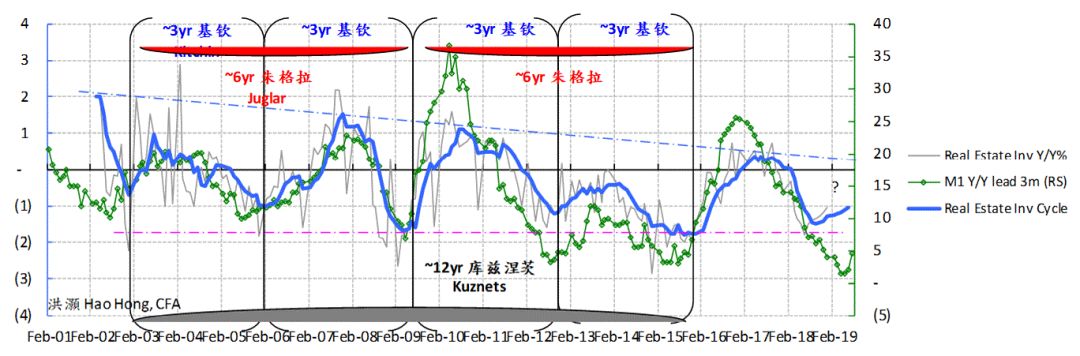
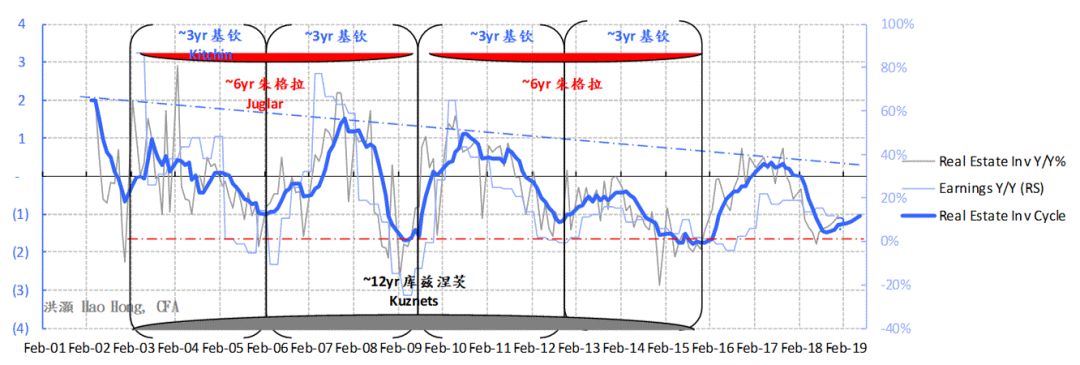
Source:
Bloomberg, BOCOM Int'l
Note:
Property construction, part of overall completed property investment that also includes land purchase, is more closely correlated with economic activities. Due to the irregularities of the data release since 2017, we have used the construction data series to calculate the property investment cycle. Only selected cyclical charts are shown here. For complete detailed discussions on China’s 3-year short economic cycle, please refer to your reports titled “
A Definitive Guide to China’s Economic Cycles
” (20170324) and “
A Definitive Guide to China’s Economic Cycles II – New High”
(20170828).
But cyclicals have not participated in this rally in full.
Given that the cycle is truly turning, it is reasonable to assume that cyclicals should lead the current rally. However, the reality is quite the contrary:
YTD, there is no clear leadership from the cyclicals; forestry, fishery and animal husbandry has been the best performing sector, followed by food and beverages, home appliances, etc.
There are pockets of cyclical strength, which, however, is not prominent. Overall, cyclicals’ relative performance as a whole continue to languish around low levels consistent with levels seen at the inflection points of previous economic cycles (
Figure 4
). That is, the market is still in doubt of the cyclical recovery, and such qualms are shown in the cyclicals’ weak relative performance.
Figure 4:
The relative performance of cyclicals has not reflected the upturn of China’s economic cycle
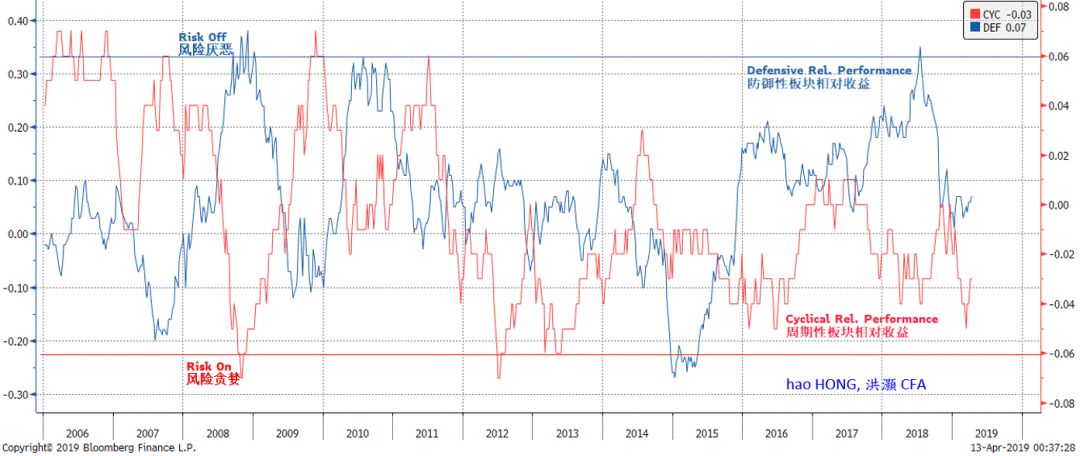
Source: Bloomberg, BOCOM Int'l
Market sentiment hints at skepticism towards the current market recovery.
Years ago when we first returned from Wall Street to apply western market theories to analyze the Chinese mainland market, we created the first market sentiment model for the A-share market based on behavioral economics.
Our market sentiment model triangulates the pricing discrepancies between various asset classes to find mispriced opportunities. It is a contrarian indicator of the forward return of the A-share market:
the more cautious the market sentiment is as implied in the prices of various asset classes, the more constructive the outlook for market forward return.
We have given a master-class public lecture organized by one of China’s most influential new media groups on how to measure market sentiment. It is a pleasure to see that many market researchers lately have come up with their own versions of market sentiment models.
While not infallible, our market sentiment model for the A-share market did help us negotiate the tempestuous torrents in the mainland stock market, pinpointing the market inflection points in June 2013 (the liquidity crisis), August 2014 (the inception of “the Great China Bubble”), June 2015 (the peak of “the Great China Bubble”), and the market bottom in early 2016. The model performs its best at important inflection points, and less so at intertemporal fluctuation within a larger and longer trend.
Figure 5:
The market is still skeptical of the rally; cautious sentiment augurs further gains ahead
Source: Bloomberg, BOCOM Int'l
Despite the ripping rally, our sentiment model for the A-share market continues to suggest market suspicion towards the rally. Many still think that the rally is unfounded, and economic fundamentals remain feeble. For instance, the companies failing earning expectations the most have substantially outperformed. It appears to be a junk rally at this stage. But which episode of market - recovery in the A shares doesn’t start with junks and then spread out?


