
概要
1. 历史上曾有三次中国对美国出口下滑的情况和现在类似,甚至更糟糕。这分别是:2001年美国经济衰退期间,2008年全球金融危机以及2016年美联储开始缩表而导致经济大幅放缓。相对于中国出口增速的大幅下滑,目前上证年化回报率的调整似乎仍不充分。
如果出口增长与股指年化回报之间的历史关系保持大致稳定,则上证的最坏情景大约为2100左右。这个指数水平与我们去年11月的2019年展望报告中论述的极端风险情景大致吻合。然而,美国约占中国出口的15%。如果把对美出口放缓孤立来看,而且股市往往领先于出口增长,那么有些人可能会基于去年市场已然暴跌而认为目前的调整已经到位了。当然,真实的情况很可能介于两个极端之间。
2. 上证的市盈率已经大致跌至2008年金融危机和2016年股票泡沫破灭后的水平。因此,市场价格似乎已经计入了贸易战的基准情形。如果市盈率要重新回到2017年或更高的水平,历史经验表明将需要重大的政策刺激,或有形之手积极的干预。但它同时也意味着贸易谈判失意。这并不是我们的基准情景,隐含的政策应对也与最近的政策基调相矛盾。
如果市盈率继续压缩至历史最低水平约9到10倍,应该意味着:1)贸易前景恶化,类似于2018年下半年。即便如此,我们预计今年一月份上证运行到的、2450这个关键的底部点位应该继续有效。因为即使在同样的历史最低的估值水平上,盈利已经增长了; 2)又或者资金持续向中小盘股和创业板轮动,类似于2012-2014年的情形。当时创业板的盈利改善速度相对于主板更快,创业板指数开始走牛。实际上,创业板的盈利在今年一季度已显着恢复,与中国经济的短周期的复苏一致。无论以上哪种情景出现,估值的进一步压缩并不完全意味着绝对悲观的情景。
3. 如果贸易摩擦永久性地降低中国GDP增长率1%,那么中国经济的增长轨迹斜率将变得更加平坦,再次对应风险情景下上证2000点左右的水平。美债的隐含波动率、美国国债收益率曲线的倒挂、我们独有的美国经济周期运行指标,以及其它风险资产的价格运行情况,如美国大豆期货的破位和道指的三重顶,都预示着美国经济增长将减速,股市将调整。然而,美国股市的调整反而有利于贸易谈判。
因此,市场价格似乎已经计入了贸易摩擦的基准情景,但风险情景的可能性正在上升,导致预期的收益降低。
由于近期市场将继续被新闻标题左右,多空都难以下注。市场受困于一个交易区间。我们继续抱着最好的期望,做最坏的打算。
这是我们20190529的报告《
2019下半年展望:贸易摩擦的代价
》的英文原版。感谢阅读。
----------------------------------------
1. There have been three episodes in history when Chinese exports to the US fell as deep as or deeper than it does now: during the 2001 US recession, 2008 global financial crisis, and the significant slowdown in 2016 when the Fed started its balance sheet run-off. The current correction in annualized return of the Shanghai Composite (SHCOMP) appears too shallow given the sharp decline in Chinese exports.
If the historical relationship between exports growth and index annualized return persists, the worst case for SHCOMP should be ~2,100, roughly consistent with the risk scenario outlined in our 2019 outlook report last November. That said, the US accounts for ~15% of Chinese exports. If the slowdown in exports to the US is isolated, and stocks tend to lead exports growth, then some may argue that the current correction has run its course, given the market plunge in 2018. The truth is likely to be somewhere in between.
2. The P/E of SHCOMP has fallen to the level seen during the 2008 financial crisis and in 2016 after the stock bubble burst. As such, the market has priced in the base case of the trade war. For P/E multiple to re-expand to the level in 2017 or above, significant policy stimulus or vigorous “national team” intervention will be required. But it will also imply a no-deal scenario, which is not our base case. It contradicts the recent policy tones as well.
If P/E continues to compress towards the lowest historical level of 9-10x, then it should imply: (1) either worsening prospects of the trade talks similar to the second half of 2018; even so, we expect the critical level of ~2,450 to hold, as at the same multiple, earnings have grown; (2) or funds rotating towards small caps and ChiNext in a similar fashion as in 2012-14, when ChiNext soared because of improving earnings relative to the main board. Indeed, ChiNext earnings recovered significantly during 1Q19, consistent with a turn in China’s short economic cycle. In either scenario, further valuation compression does not imply hopeless eventuality.
3. If the trade friction shaves 1% off China’s GDP growth permanently, China’s growth trajectory will be flatter, corresponding to SHCOMP at ~2,000 (again). The implied vol in US bonds, the inverted US yield curve, our falling US economic cycle indicator, as well as the bearish movements in the prices of many risk assets such as the US soybean and the Dow, suggest that risks are elevated in the near term, and US growth will decelerate. A US market correction will indeed facilitate the trade talks.
The market appears to have priced in the base case of the trade war, but the probability of the risk scenario is rising, skewing the expected payoff lower.
With the market reeking of headline risks, it is difficult to bet directionally. The market is stuck in a range. We continue to hope for the best, while preparing for the worst.
What Price for the Trade War
The trade negotiation unexpectedly took a wrong turn in early May. Risk assets have been under pressure. Since we saw the long-term allocation value in the A shares in January, till we switch back to risk-management mode in May, we have regurgitated ~1/3 of our gain. It is a humbling experience, and will certainly not be our last. While we continue to believe that the long-term trend trumps short-term fluctuations, short-term noises can still overwhelm even the staunchest long-term investors – especially in a market where fund managers are measured and ranked daily.
As we were discussing the market with our clients and friends during a mahjong game, the stress was palpable. But the fund managers were a rambunctious bunch, with a good sense of humor. “
Don't worry,
” one of them said as he was dealt a hand that was hard to “mahjong”. “
You play mahjong for the money, or for the fun? Stocks are the same.
” All of us were greatly amused by his comment, and “gan-bei” the Moutai in our cups.
In this note, we try our best to provide some perspectives on how the market is pricing in the impact of the tense trade talks. We cannot claim that we have arrived at definitive answers. But directional judgments based on our analysis are possible.
Risks Still Elevated
The Shanghai Composite has declined around 10%, and entered the correction territory. Now the question is whether this is simply a pause, or the market has peaked.
To answer this question, we compare the price change in US bond swaption with the annualized return of the Chinese stocks represented by the CSI300 index. We can see that, since the 2008 financial crisis, the swaption price change has been inversely correlated with the return of CSI300 – except during the Chinese market bubble in 2015 when fundamentals had clearly deteriorated, but stock prices continued to soar unfettered (
Figure 1
).
Figure 1: Bond vol implies persistent pressure on Chinese stocks
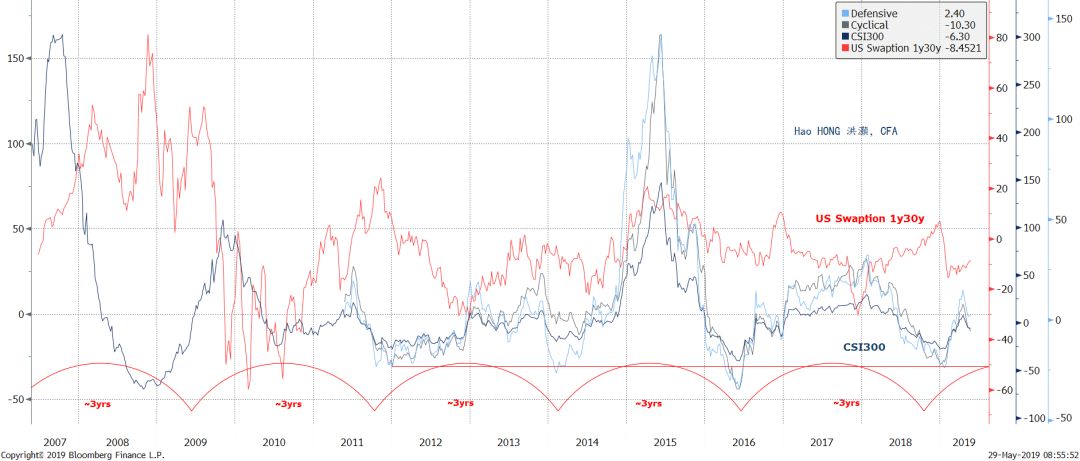
Source: Bloomberg, BOCOM Int'l
Currently, the swaption price change has started to climb, and will likely rise further. Meanwhile, the annualized return of the CSI300 index peaked in early May, after making an important low in the first week of January 2019. Such a pattern suggests that the pressure on the Chinese market is likely to persist in the near term. This phenomenon is a reflection of the uncertainties surrounding the trade talks.
The movements in other risk asset prices also seem bearish. In
Figure 2
, we show that the Dow is running into significant triple tops. That said, the US market developed the same technical pattern between 2015 and 2016 when the Chinese stock bubble burst upset the entire globe, followed by the volatility ushered in by the unexpected Brexit and Trump’s election victory.
Figure 2: Dow triple tops
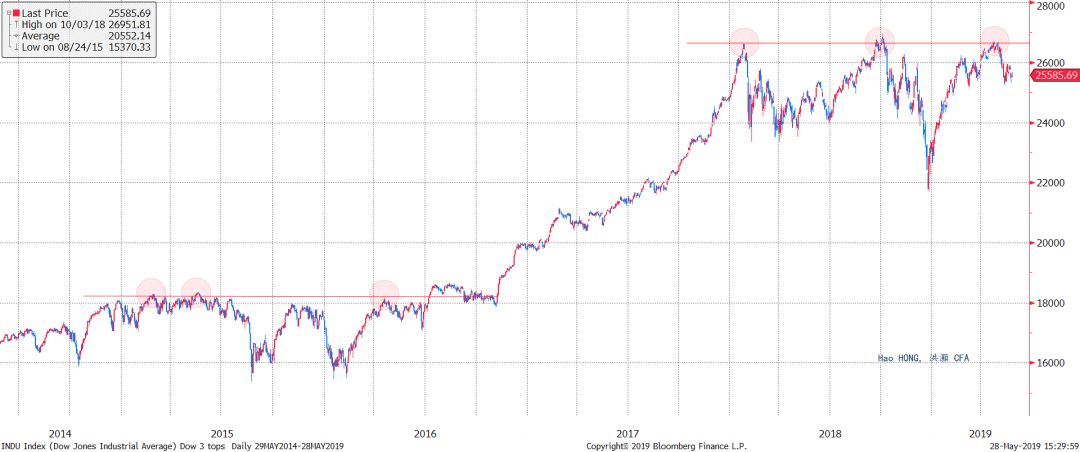
Source: Bloomberg, BOCOM Int'l
Meanwhile, the US soybean futures broke below the support level in 2018 during the escalating trade tension, but then somehow recovered (
Figure 3
). Further, in our previous note titled “
War and Peace
”, we discussed how the long-term support trend line for the Hang Seng has turned into near-term resistance, and the CNY’s depreciation pressure is at a critical level last experienced in 2016 when the currency was crashing towards 7 (Charts are not shown again here). Besides the inverting US yield curve, our proprietary US economic cycle indicator continues to fall. Together with the falling growth of US semi shipments, our indicator is portending deceleration of US growth ahead (
Figure 4
).
Figure 3: US soybean futures broke its support level, but somehow recovered
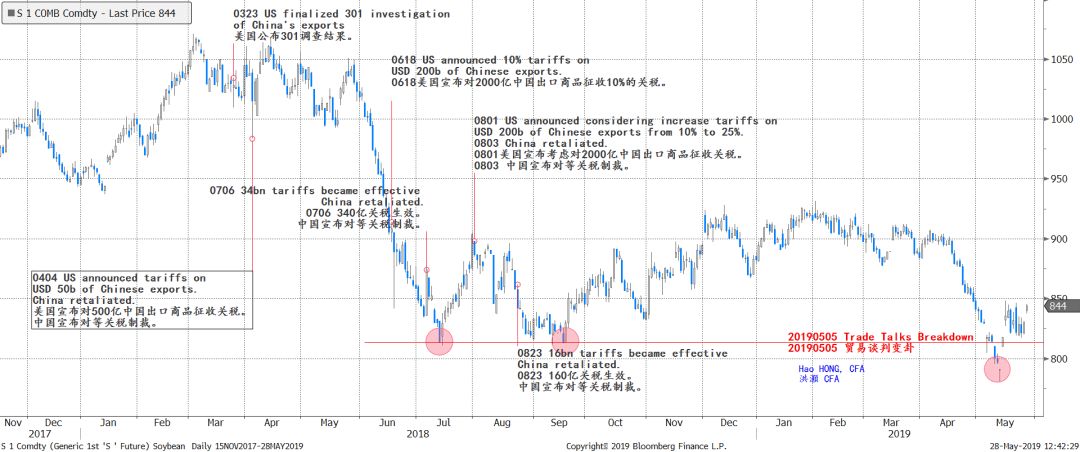
Source: Bloomberg, BOCOM Int'l
Figure 4: US economic cycle and semi shipments are falling, portending decelerating growth ahead
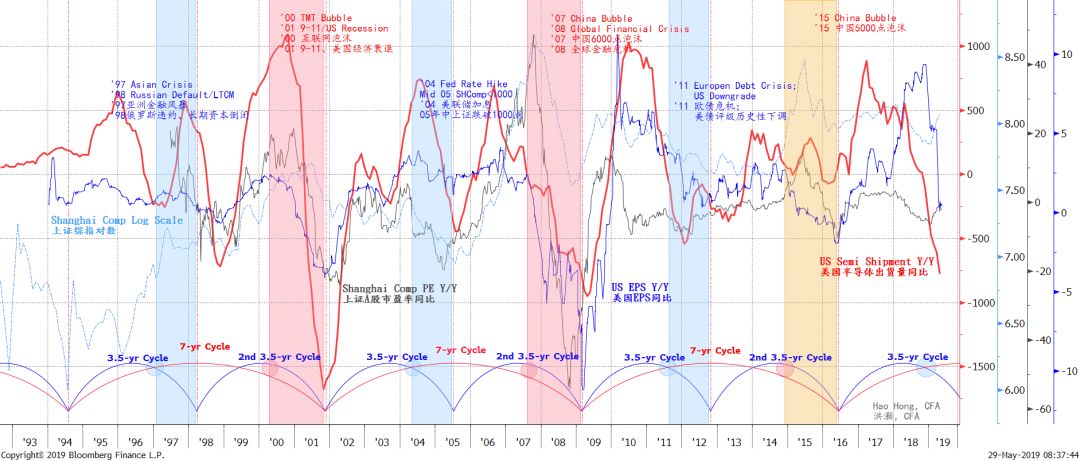
Source: Bloomberg, BOCOM Int'l
PBoC Unlikely to Ease Much Further
In the past decade, the few episodes of market crises in US and China were rescued by the Fed and the PBoC. Every time the market plunged, the central banks started to ease monetary policy – hence the term the “Fed Put” and the “PBoC Put”. It is difficult to judge the social implications of these easing tendencies. But if the central bank’s policy target is to generate employment growth and maintain price stability, then the banks are doing a very fine job. We show the central banks’ interventions at various important inflection points of the stock markets in the following charts (
Figure 5
).
Figure 5: “Fed Put” and “PBoC Put”
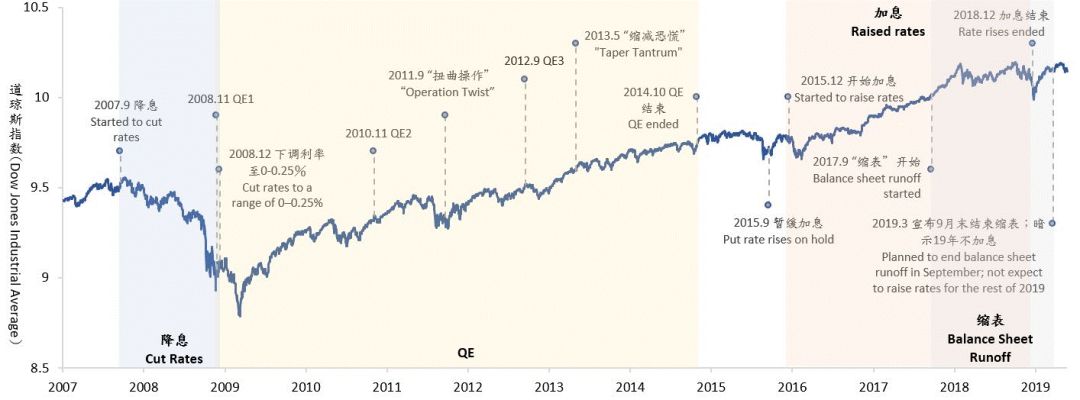
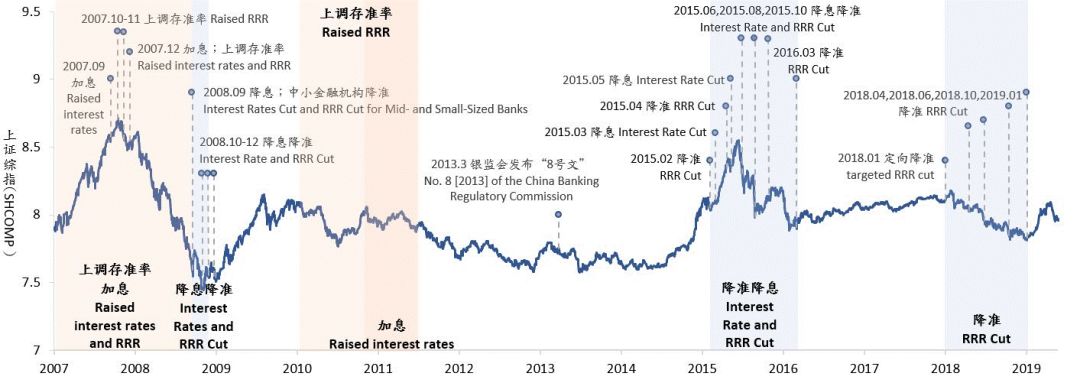
Source: Bloomberg, BOCOM Int'l
But after years of monetary easing to prolong the economic cycle, it is unclear whether the central banks could ease much further. In the above chart, we can see that the Fed’s balance sheet continues to run off. For the PBoC, we use the change in RRR as a proxy to gauge the central bank’s easing tendency. Historically, the change in RRR and the change in Chinese inflationary pressure measured by CPI are mostly in tandem – except for two episodes: (1) during and after the 2015 stock market bubble; and (2) from 2018 till now.
Arguably, the central bank’s easing stance even as inflationary pressure persisted in 2015 while the economic fundamentals were deteriorating was the cause of the stock market bubble then – in hindsight. But it was not enough to arrest the market plunge until the market valuation had regressed to normal levels.
Since 2018, the PBoC again has been cutting RRR consistently despite lingering inflationary pressure yet decelerating economic growth. But the change in RRR appears to have arrived at a near-term turning point, as China’s short economic cycle starts to stabilize in the first quarter of 2019 – unless the trade disputes deteriorate much further from here and drag the economy down with it (
Figure 6
).
Figure 6: PBoC’s easing stance has changed, but will likely stay accommodative
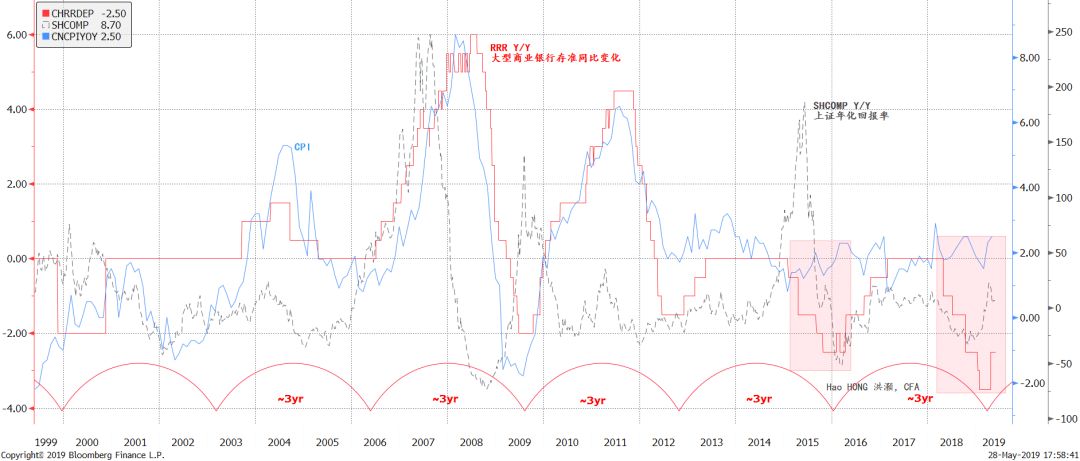
Source: Bloomberg, BOCOM Int'l
In short, if the PBoC is unlikely to be more accommodative, barring the risk scenario in which trade talks break down completely, then stocks will have to rely on improving earnings growth to deliver further gains. The PBoC will resort to drastic measures, should the trade talks break down completely.
The Price of Trade War
How is the market pricing in the impact of the trade war? There has been much debate. But with tempestuous news headlines fanned by Trump’s erratic tweets, it is challenging to find a definitive answer. Our methodology primarily relies on studies of the market history, and using various nadirs in market indices as reference points to gauge how much the current market prices reflect or imply. It is imperfect – we know. But we have used three different ways to triangulate an answer that get us closer to the shifting reality.
(1)
In the past, there have been three episodes when Chinese exports to the US plunged significantly: during the 2001 US recession, 2008 global financial crisis and the 2016 slowdown. We can then measure the stock market’s response to each of these episodes of exports decline to see how the current market correction is reflecting the slowdown in exports.
The current decline in Chinese exports growth is rapidly approaching the depth of 2016, and is indeed worse than that during the 2001 US recession (
Figure 7
). Yet, the annualized return on Chinese stocks suggests that the market correction, while swift, appears far from fully pricing in the impact of the slowdown in Chinese exports to the US. The annualized return in Chinese markets remains elevated. The market response to the trade war and its impending consequences is far less severe than that during previous episodes of exports slowdown.
Figure 7: Stock return does not appear to have adjusted for deterioration in exports growth
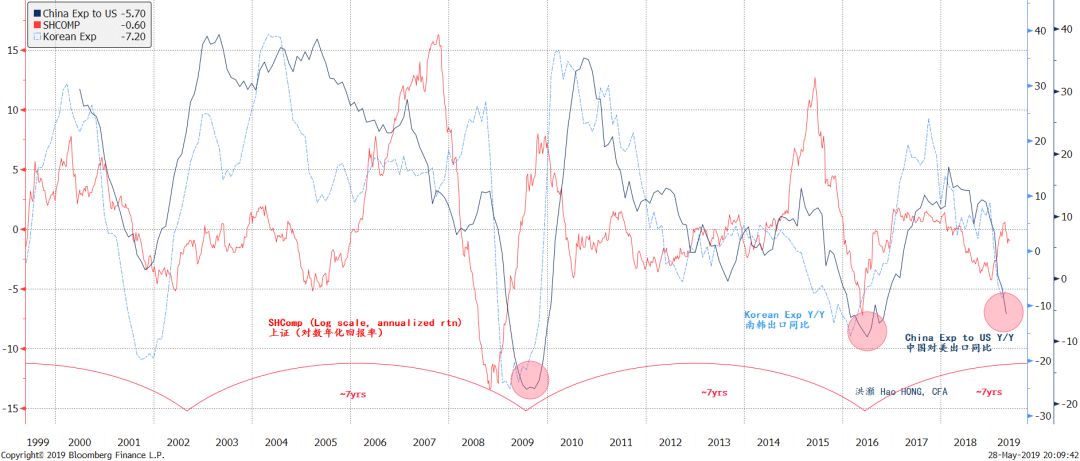
Source: Bloomberg, BOCOM Int'l
Of course, in the previous episodes, the plunge of Chinese exports is global in nature. That is, Chinese exports to countries and regions other than the US also fell sharply. So far, Chinese exports to Europe, now a larger part of China’s foreign trade than the US, have remained resilient. And the US is roughly 15% of Chinese exports. If so, the market seems to be pricing in only the slowdown of Chinese exports to the US, while anticipating exports to other regions and countries will be stable.
Of course, given that stocks tend to lead exports slowdown by six months, one could argue that the plunge in 2018 was indeed the reflection of the current exports slowdown. But we would rather be more conservative. If we apply the historical relationship between export growth and stock market return, assuming exports to all countries and regions are highly correlated during difficult times, then the Shanghai Composite would be trading at ~2,100 – largely consistent with our risk scenario for the Shanghai Composite of ~2,000 laid out in our 2019 outlook report titled “


