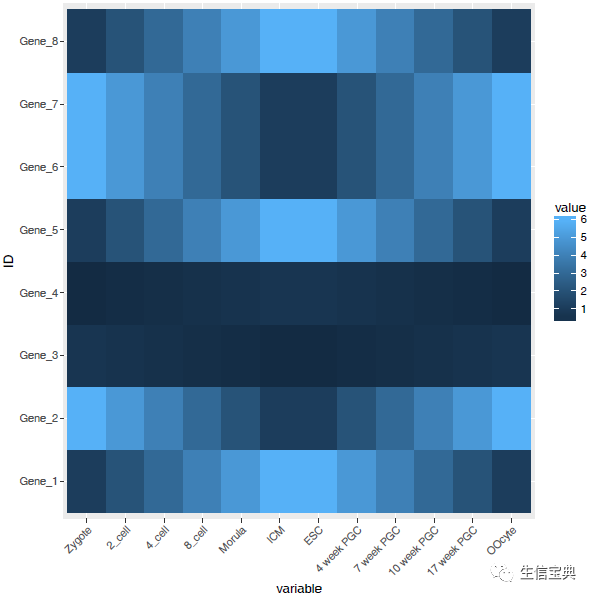
热图绘制
热图是做分析时常用的展示方式,简单、直观、清晰。可以用来显示基因在不同样品中表达的高低、表观修饰水平的高低等。任何一个数值矩阵都可以通过合适的方式用热图展示。
本篇使用R的
ggplot2
包实现从原始数据读入到热图输出的过程,并在教程结束后提供一份封装好的命令行绘图工具,只需要提供矩阵,即可一键绘图。
上一篇讲述了Rstudio的使用作为R写作和编译环境的入门,后面的命令都可以拷贝到Rstudio中运行,或写成一个R脚本,使用
Rscript heatmap.r
运行。我们还提供了Bash的封装,在不修改R脚本的情况下,改变参数绘制出不同的图形。
生成测试数据
绘图首先需要数据。通过生成一堆的向量,转换为矩阵,得到想要的数据。
data 1:6,6:1,6:1,1:6, (6:1)/10,(1:6)/10,(1:6)/10,(6:1)/10,1:6,6:1,6:1,1:6, 6:1,1:6,1:6,6:1)
 [1] 1.0 2.0 3.0 4.0 5.0 6.0 6.0 5.0 4.0 3.0 2.0 1.0 6.0 5.0 4.0 3.0 2.0 1.0 1.0
[20] 2.0 3.0 4.0 5.0 6.0 0.6 0.5 0.4 0.3 0.2 0.1 0.1 0.2 0.3 0.4 0.5 0.6 0.1 0.2
[39] 0.3 0.4 0.5 0.6 0.6 0.5 0.4 0.3 0.2 0.1 1.0 2.0 3.0 4.0 5.0 6.0 6.0 5.0 4.0
[58] 3.0 2.0 1.0 6.0 5.0 4.0 3.0 2.0 1.0 1.0 2.0 3.0 4.0 5.0 6.0 6.0 5.0 4.0 3.0
[77] 2.0 1.0 1.0 2.0 3.0 4.0 5.0 6.0 1.0 2.0 3.0 4.0 5.0 6.0 6.0 5.0 4.0 3.0 2.0
[96] 1.0
注意:运算符的优先级。
> 1:3+4
[1] 5 6 7
> (1:3)+4
[1] 5 6 7
> 1:(3+4)
[1] 1 2 3 4 5 6 7
Vector转为矩阵 (matrix),再转为数据框 (data.frame)。
data 12, byrow=T))
V1  V2  V3  V4  V5  V6  V7  V8  V9 V10 V11 V12
1 1.0 2.0 3.0 4.0 5.0 6.0 6.0 5.0 4.0 3.0 2.0 1.0
2 6.0 5.0 4.0 3.0 2.0 1.0 1.0 2.0 3.0 4.0 5.0 6.0
3 0.6 0.5 0.4 0.3 0.2 0.1 0.1 0.2 0.3 0.4 0.5 0.6
4 0.1 0.2 0.3 0.4 0.5 0.6 0.6 0.5 0.4 0.3 0.2 0.1
5 1.0 2.0 3.0 4.0 5.0 6.0 6.0 5.0 4.0 3.0 2.0 1.0
6 6.0 5.0 4.0 3.0 2.0 1.0 1.0 2.0 3.0 4.0 5.0 6.0
7 6.0 5.0 4.0 3.0 2.0 1.0 1.0 2.0 3.0 4.0 5.0 6.0
8 1.0 2.0 3.0 4.0 5.0 6.0 6.0 5.0 4.0 3.0 2.0 1.0
colnames(data) "Zygote","2_cell","4_cell","8_cell","Morula","ICM","ESC","4 week PGC","7 week PGC","10 week PGC","17 week PGC", "OOcyte")
rownames(data) "Gene", 1:8, sep="_")
head(data)[,1:4]
    Zygote 2_cell 4_cell 8_cell
Gene_1    1.0    2.0    3.0    4.0
Gene_2    6.0    5.0    4.0    3.0
Gene_3    0.6    0.5    0.4    0.3
Gene_4    0.1    0.2    0.3    0.4
Gene_5    1.0    2.0    3.0    4.0
Gene_6    6.0    5.0    4.0    3.0
虽然方法比较繁琐,但一个数值矩阵已经获得了。
还有另外2种获取数值矩阵的方式。
> txt "ID;Zygote;2_cell;4_cell;8_cell
+ Gene_1;1;2;3;4
+ Gene_2;6;5;4;5
+ Gene_3;0.6;0.5;0.4;0.4"
> data2 ";", header=T, row.names=1, quote="")
> head(data2)
Zygote X2_cell X4_cell X8_cell
Gene_1 1.0 2.0 3.0 4.0
Gene_2 6.0 5.0 4.0 5.0
Gene_3 0.6 0.5 0.4 0.4
可以看到列名字中以数字开头的列都加了
X
。一般要尽量避免行或列名字以
数字开头
,会给后续分析带去一些困难;另外名字中出现的非字母、数字、下划线、点的字符都会被转为
点
,也需要注意,尽量只用字母、下划线和数字。
> data2 ";", header=T, row.names=1, quote="", check.names = F)
> head(data2)
Zygote 2_cell 4_cell 8_cell
Gene_1 1.0 2.0 3.0 4.0
Gene_2 6.0 5.0 4.0 5.0
Gene_3 0.6 0.5 0.4 0.4
与上一步类似,只是改为文件名,不再赘述。
> data2 "filename",sep=";", header=T, row.names=1, quote="")
转换数据格式
数据读入后,还需要一步格式转换。在使用ggplot2作图时,有一种长表格模式是最为常用的,尤其是数据不规则时,更应该使用 (这点,我们在讲解箱线图时再说)。
library(reshape2)
library(ggplot2)
data$ID
data_m "ID"))
head(data_m)
    ID    variable value
1  Gene_1      Zygote   1.0
2  Gene_2      Zygote   6.0
3  Gene_3      Zygote   0.6
4  Gene_4      Zygote   0.1
5  Gene_5      Zygote   1.0
6  Gene_6      Zygote   6.0
7  Gene_7      Zygote   6.0
8  Gene_8      Zygote   1.0
9  Gene_1      2_cell   2.0
10 Gene_2      2_cell   5.0
11 Gene_3      2_cell   0.5
12 Gene_4      2_cell   0.2
13 Gene_5      2_cell   2.0
14 Gene_6      2_cell   5.0
15 Gene_7      2_cell   5.0
16 Gene_8      2_cell   2.0
分解绘图
数据转换后就可以画图了,分解命令如下:
p
p
p

热图出来了,但有点不对劲,横轴重叠一起了。一个办法是调整图像的宽度,另一个是旋转横轴标记。
p 45,hjust=1, vjust=1))
p

设置想要的颜色。
p "white", high = "red")
p

调整legend的位置。
p "top")

调整背景和背景格线以及X轴、Y轴的标题。(注意灰色的背景没了)
p "samples") + theme_bw() + theme(panel.grid.major = element_blank()) + theme(legend.key=element_blank())
p

合并以上命令,就得到了下面这个看似复杂的绘图命令。
p "samples") + theme_bw() + theme(panel.grid.major = element_blank()) + theme(legend.key=element_blank()) + theme(axis.text.x=element_text(angle=45,hjust=1, vjust=1)) + theme(legend.position="top") + geom_tile(aes(fill=value)) + scale_fill_gradient(low = "white", high = "red")
图形存储
图形出来了,就得考虑存储了,
ggsave(p, filename="heatmap.pdf", width=10,
height=15, units=c("cm"),colormodel="srgb")
至此,完成了简单的heatmap的绘图。但实际绘制时,经常会碰到由于数值变化很大,导致颜色过于集中,使得图的可读性下降很多。因此需要对数据进行一些处理,具体的下次再说。


