我写的文章
(7.5
分
)
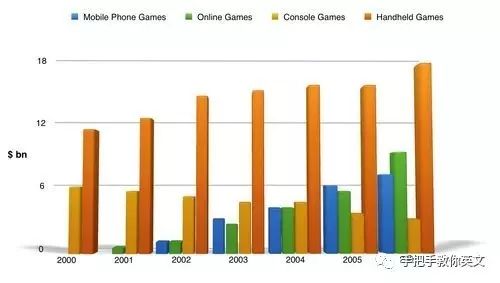
The bar charts show the changes in the revenue created by different games during the period 2000 to 2006.
The sales of handheld games were higher than those of other games throughout the 6-year-period, with the figure rising steadily to around 14 billion dollars in 2002 and staying at this level for four years. In the year 2006, the sales figure reached the peak of 18 billion or so. In contrast, console games became less popular, as the revenue dropped gradually from 6 billion in 2000 to the lowest point at 3 billion in 2006.
Mobile phone games and online games saw a similar trend, and no figures are given for them in the first year. The turnover of the mobile phone games rose nearly 7-fold to 7 billion in 2006, while that of online games had increased even at a faster pace to 10 billion by the end of the same period.
Overall, it is noticeable that handheld games were far more popular than other games, despite the rapid growth in mobile and online games. A totally different pattern was seen in console games.
前考官
Simon
的文章
The bar chart compares the turnover in dollars from sales of video games for four
different platforms,
namely mobile phones, online, consoles and handheld devices, from 2000 to 2006.
It is clear that sales of games for three out of the four platforms rose each year, leading to
a significant rise
in total global turnover over the 7-year period. Sales figures for handheld games were
at least twice as high as
those for any other platform in almost every year.
In 2000, worldwide sales of handheld games stood at around $11 billion, while console games earned
just under
$6 billion. N
o figures are given f
or mobile or online games in that year. Over the next 3 years, sales of handheld video games rose by about $4 billion, but the figure for consoles decreased by $2 billion. Mobile phone and online games started to become popular,
with sales re
aching around $3 billion in 2003.
In 2006, sales of handheld, online and mobile games
reached peaks of 1
7, 9 and 7 billion dollars respectively. By contrast,
turnover from
console games d
ropped to its lowest point,
at around $2.5 billion.
差异和类似之处:
-
我和
Simon
都用了
turnover
,
sales figures
来替换
sales
,我还用了
revenue
-
我们的句式变化也差不多,都使用了
with.. doing, while
等句子,虽然
SIMOn
的
twice as high as
,总结的很好。
-
思路上,
SIMON
用的是第一年读数据对比,然后再写趋势。而我是一个个对象去写。

新的精品班(170430)4月30号开始写作正课(课前语法福利课已经开始,适合5月底或者6月考试的同学)。针对5月考试的0422词伙预测班4月22号开始正课。现均已开始报名。
对网络课程咨询和报名感兴趣的同学,请点击左下右方的
“
阅读原文
”
或发信息
“
课表
”
至对话框,获得更多课程信息
↓↓↓↓


