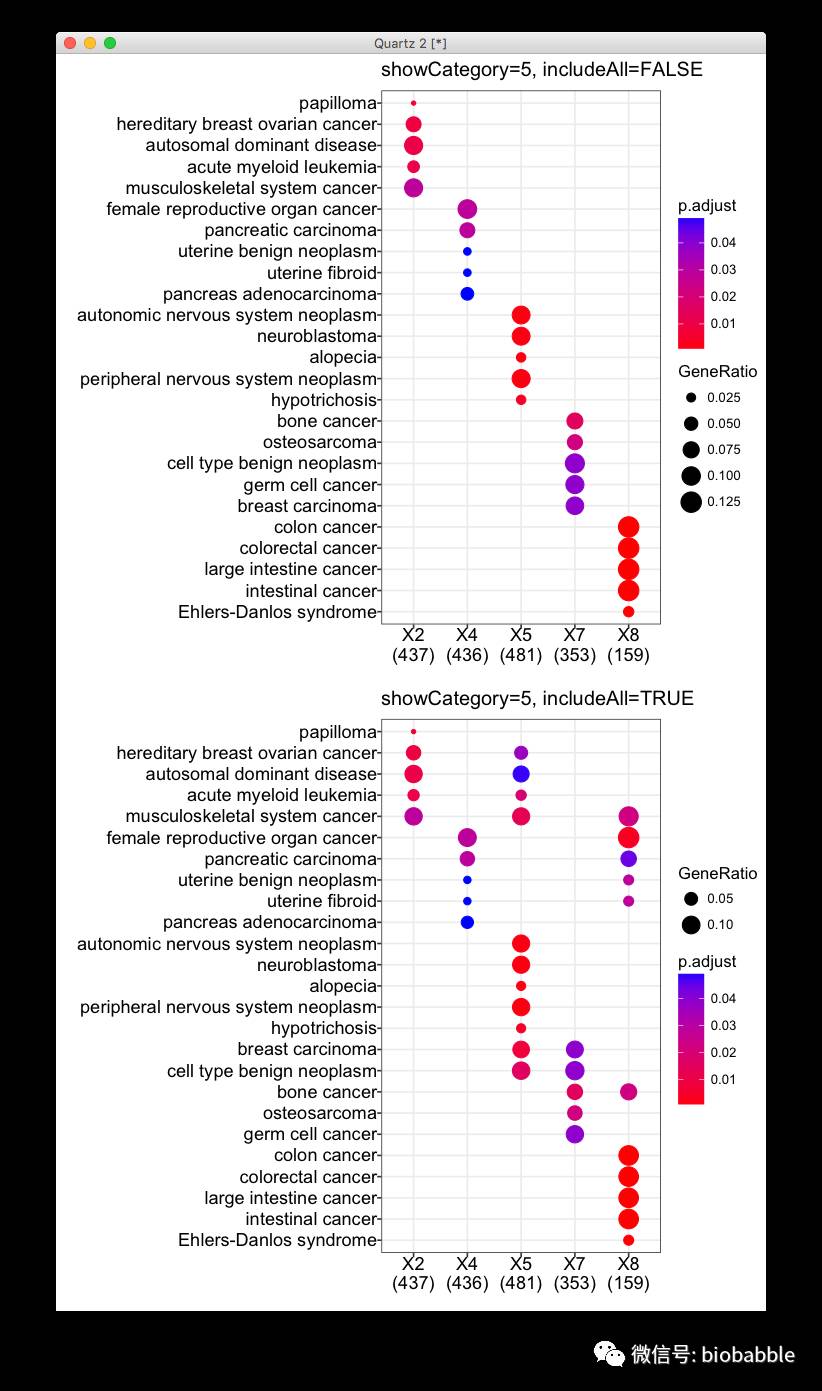
I am using dotplot() to visualize results from enrichGO(), enrichDO(), enricher() and compareCluster() in clusterProfiler R package. When specifying showCategory, I get the right number of categories except with the results of compareCluser().
In my case, I use compareCluster() on a list of 3 elements:
str(ClusterList)
List of 3
 $ All : chr [1:1450] "89886" "29923" "100132891" "101410536" ...
 $ g1  : chr [1:858] "89886" "29923" "100132891" "101410536" ...
 $ g2: chr [1:592] "5325" "170691" "29953" "283392" ...
CompareGO_BP=compareCluster(ClusterList, fun="enrichGO", pvalueCutoff=0.01, pAdjustMethod="BH", OrgDb=org.Hs.eg.db,ont="BP",readable=T)

dotplot(CompareGO_BP, showCategory=10, title="GO - Biological Process")
I ask for 10 categories, but I get 15 categories in All, 8 categories in g1 and 12 categories in g2. None of the categories, neither the sum of the categories are 10…
Is the option showCategory working in the case of comparison? Am I missing something here?
And which categories precisely will it plot? the most significant whatever my 3 cases or the most significant of each case?
这是Bioconductor网站上的问题,似乎是挺让人困惑的,所以有必要写个文章解释一下。
当我们设置showCategory=10的时候,我们期望每一个Cluster给出<=10个最显著的categories,clusterProfiler的barplot和dotplot也是这么做的,所以g1给出8个,表明g1只有8个GO类别是显著的。
但为什么All是15,而g2是12?
这是因为clusterProfiler考虑了很多细节,barplot和dotplot试图让不同cluster之间的比较更加合理并给出更多的信息。对这些cluster抽取10个最显著的类别之后,clusterProfiler试图把这些cluster之间有overlap的类别信息也抽出来。
比如说,term A在所有cluster中都是富集的,它属于g1中10个最显著的类别之一,而All和g2则不是。这时候clusterProfiler会把term A在All和g2中的信息也拿出来,让dotplot/barplot的比较更合理。
当然用户也可以不要这些信息,可以用dotplot(..., includeAll=FALSE), 但这是不推荐的。下面是实例:
library(clusterProfiler)
data(gcSample)
x=compareCluster(gcSample, fun='enrichDO')
dotplot(x, showCategory=5, includeAll=FALSE)
dotplot(x, showCategory=5)

我们从上方的图中看,似乎所有的cluster富集结果完全不同,完全没有overlap一样,但这不是事实,下方的图才是真相。
Citation
Yu G, Wang L, Han Y and He Q*. clusterProfiler: an R package for comparing biological themes among gene clusters. OMICS: A Journal of Integrative Biology. 2012, 16(5):284-287.

赞赏


