本文转自Tangent90,作者JoAnn
18世纪50年代霍乱时期,
John Snow绘制的一张霍乱疫情的位置图,
并通过该图表找到了霍乱疫情源头所在。
那时起,信息设计便已出现。

不可否认,
不论大数据的视觉化还是信息的简单呈现,
我们的大脑是喜爱的。
—— 以下请与你的大脑配合起来 ——
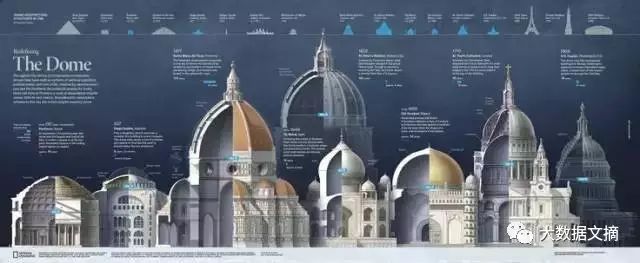
01-
Redefining the Dome by National Geographic
有关历史上著名穹顶的对比
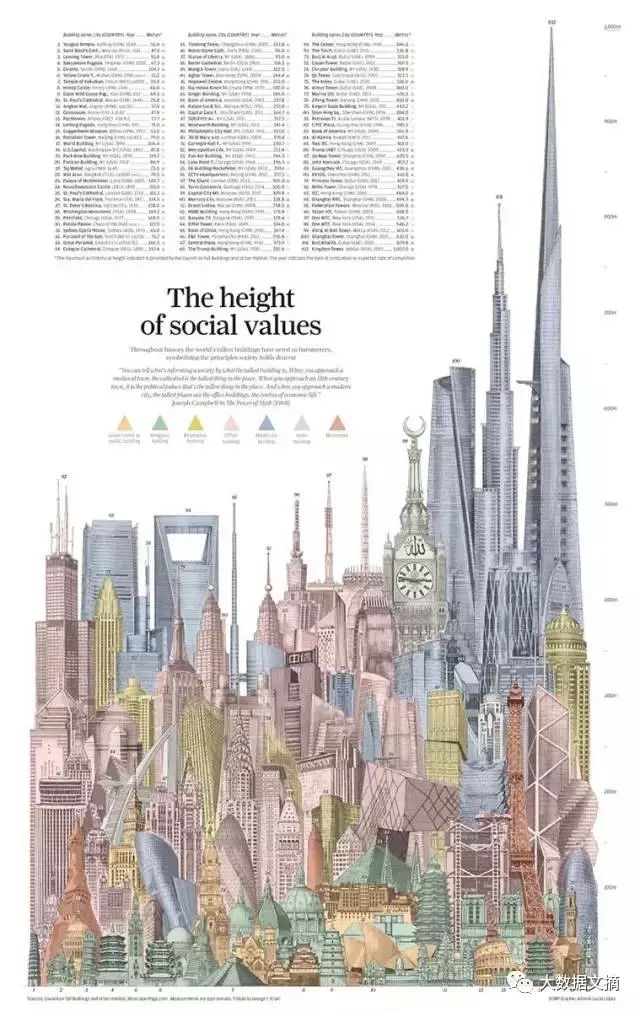
02-
Social Barometers by Alberto Lucas Lopez
全球最高建筑的对比
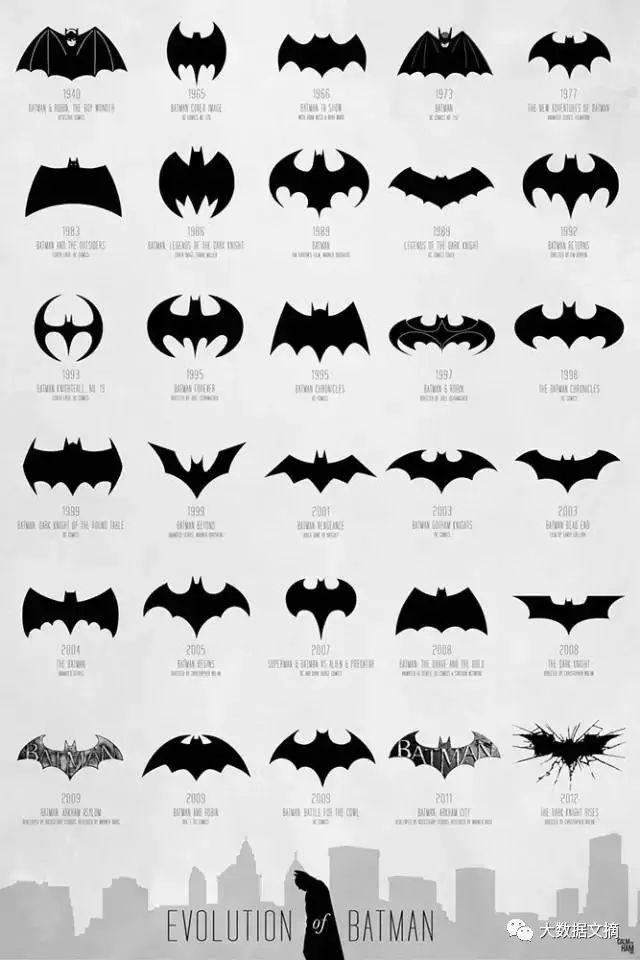
03-
Evolution of Batman by Calm the Ham
蝙蝠侠进化史
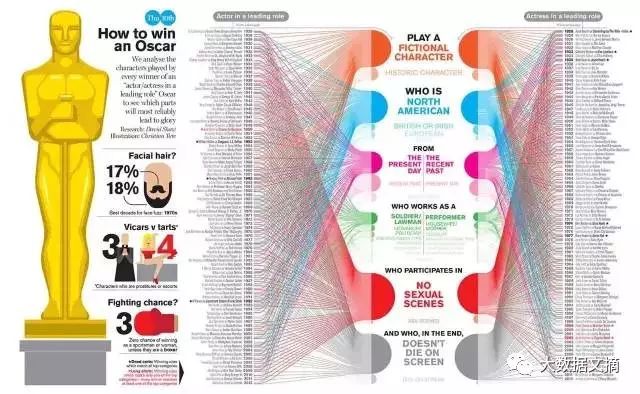
04-
How to Win an Oscar by Christian Tate
如何获得小金人
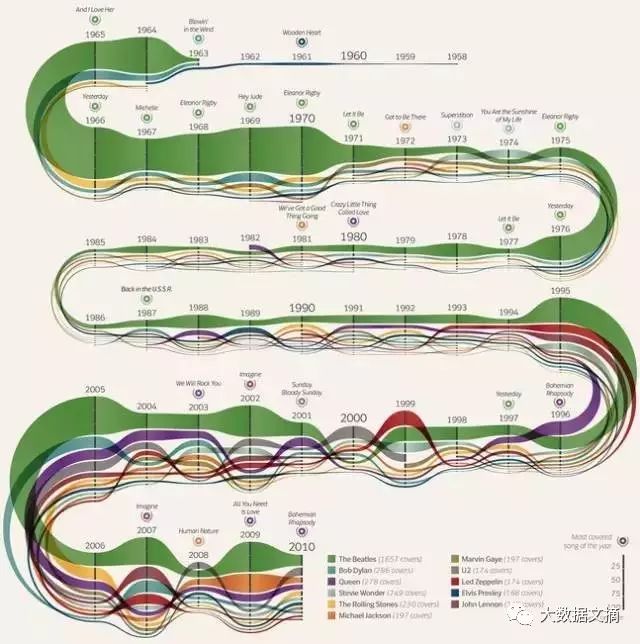
05-
Cover Mania by Michele Mauri
1958至2010年间最具影响力的音乐专辑统计
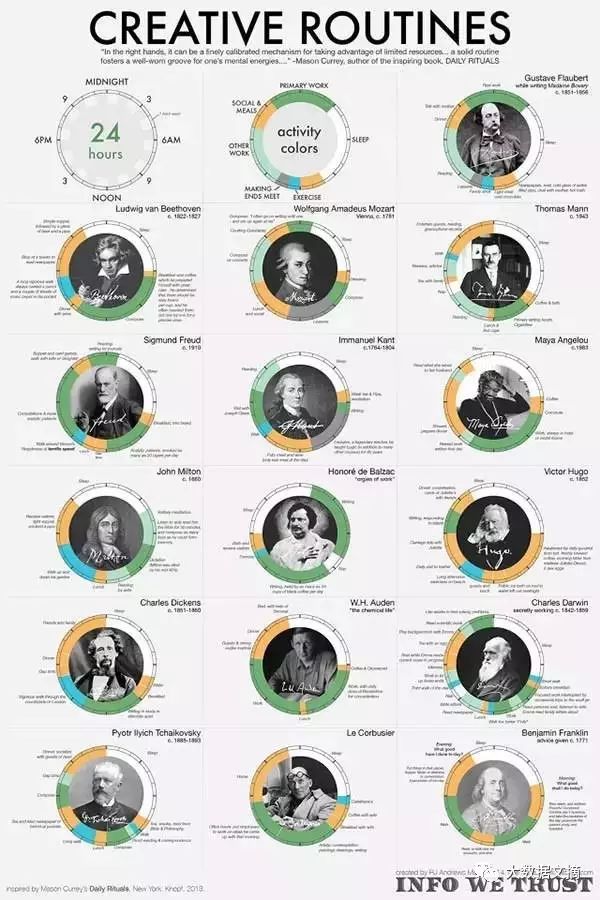
06-
Creative Routines by Info We Trust
列举了大师们一天的时间安排
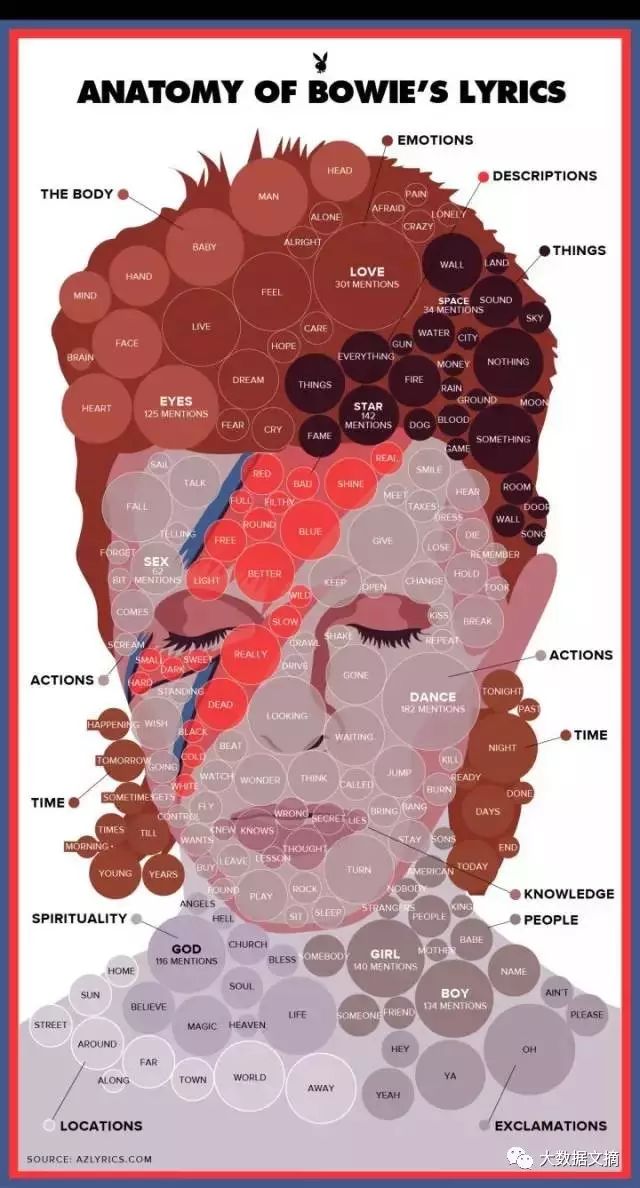
07-
Anatomy of Bowie’s Lyrics by Playboy
大卫·鲍伊(David Bowie)写歌的词频分析
08-
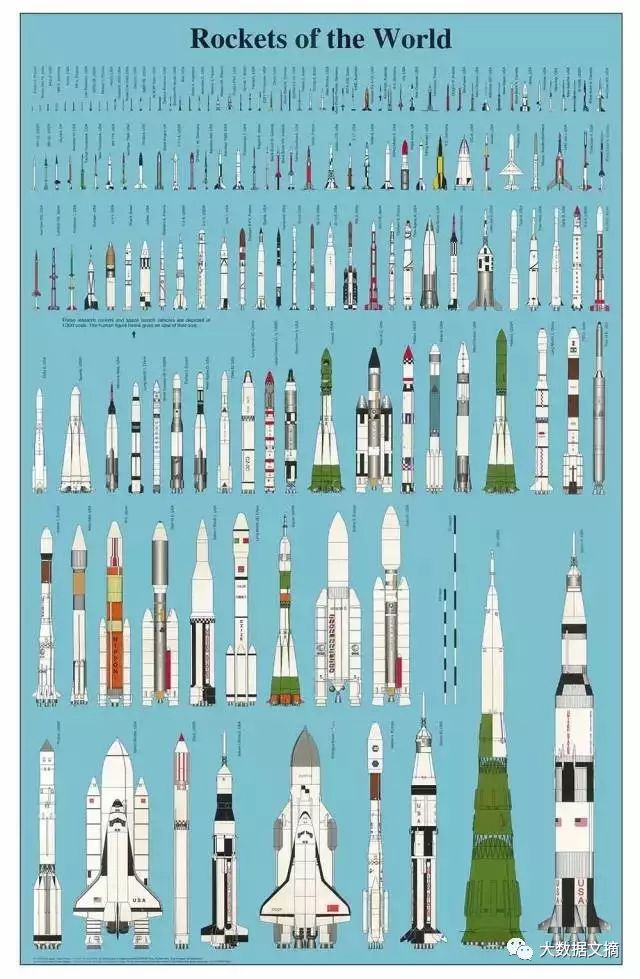
Rockets of the World by Peter Always
全球火箭大全
09-
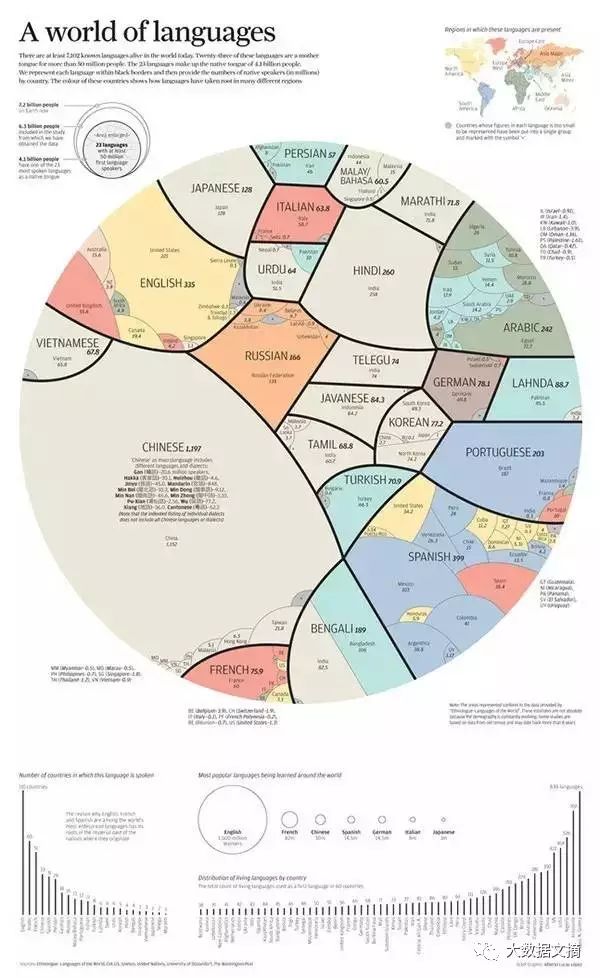
A World of Languages by Alberto Lucas López
全球语言统计
10-
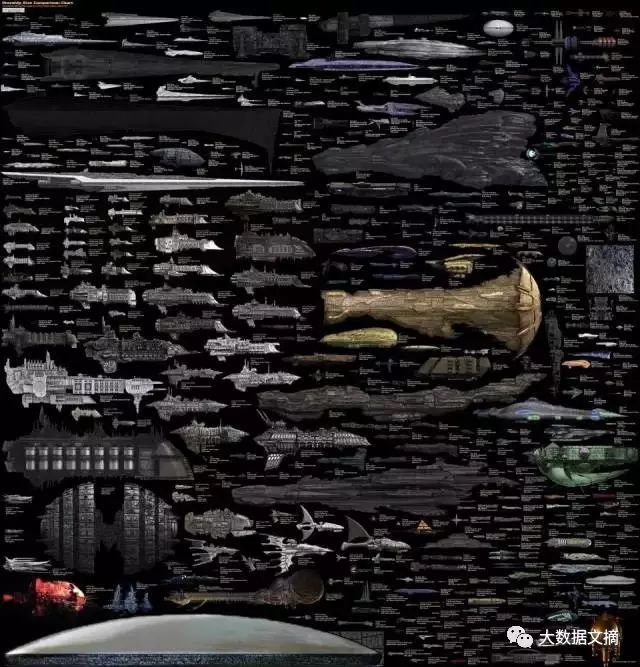
Size Comparison Science Fiction Spaceships by Dirk Loechel
科幻小说中宇宙飞船的比较
11-
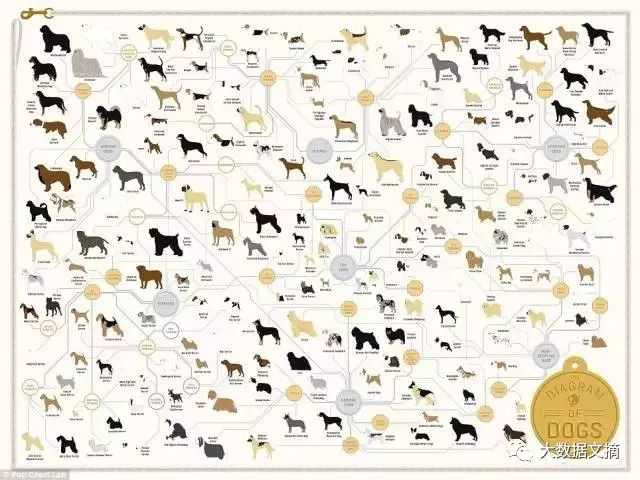
Family Tree of DOGS
狗谱
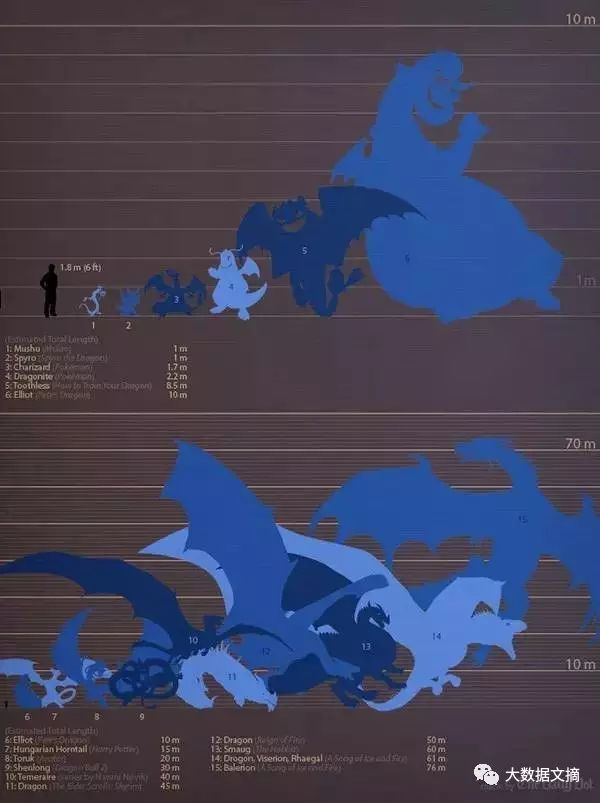
12-
How Big Are Game of Thrones Dragons by The Daily Dot
权利的游戏中的龙有多大?
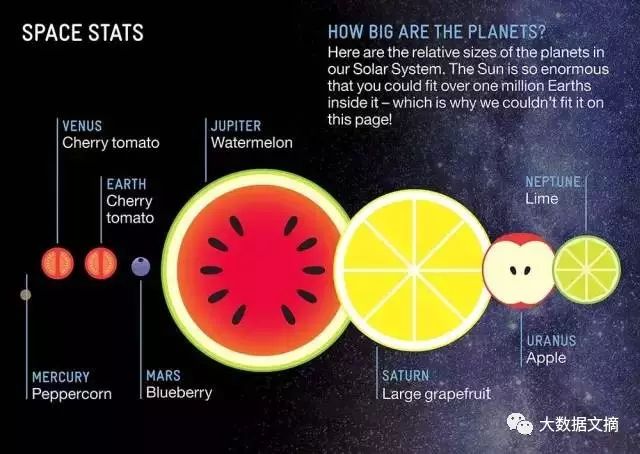
13-
Relative Scale of the Solar System Planets by Avi Solomon
太阳系行星的相对尺度
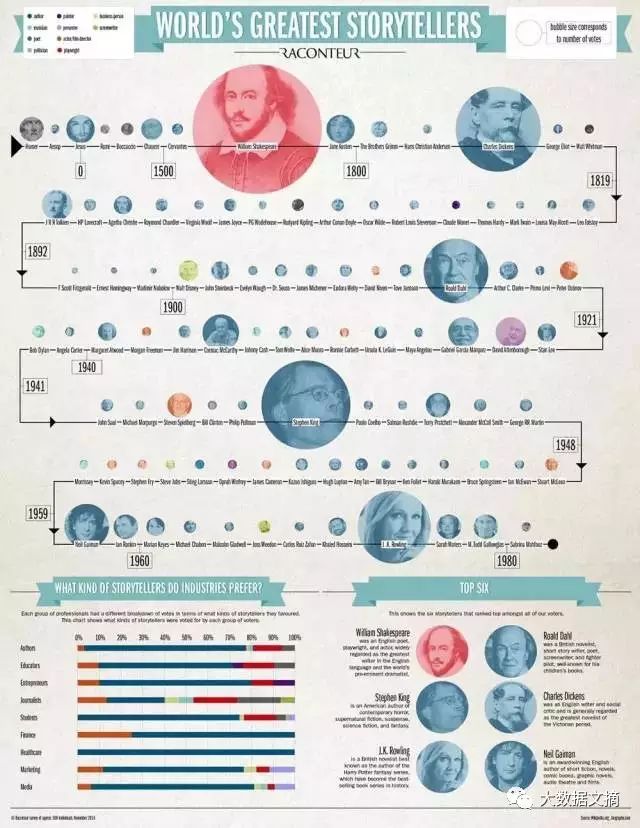
14-
World’s Greatest Storytellers by Raconteur
世界上最会讲故事的人
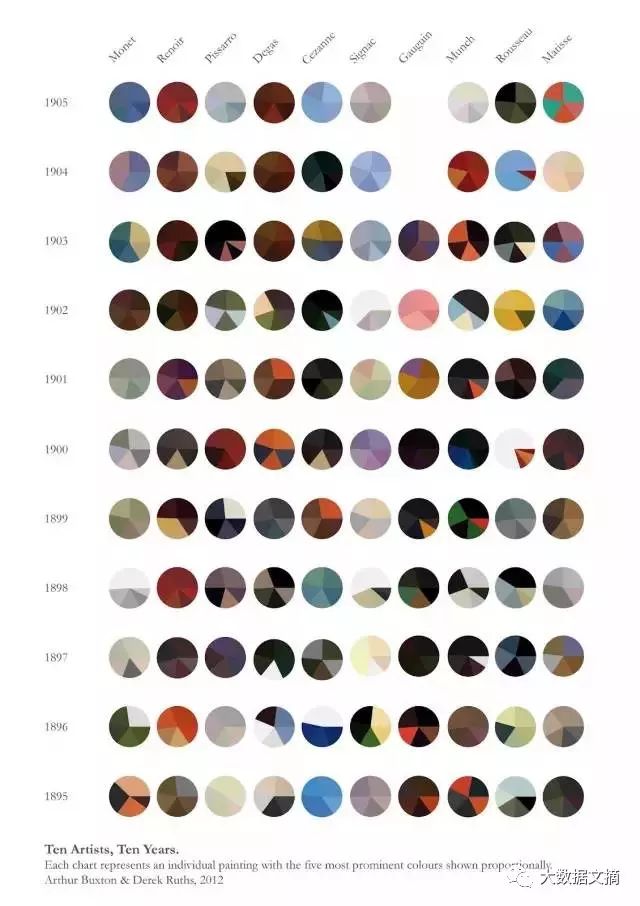
15-
Ten Artists, Ten Years by Arthur Buxton
十位艺术大师十年的色彩
16-
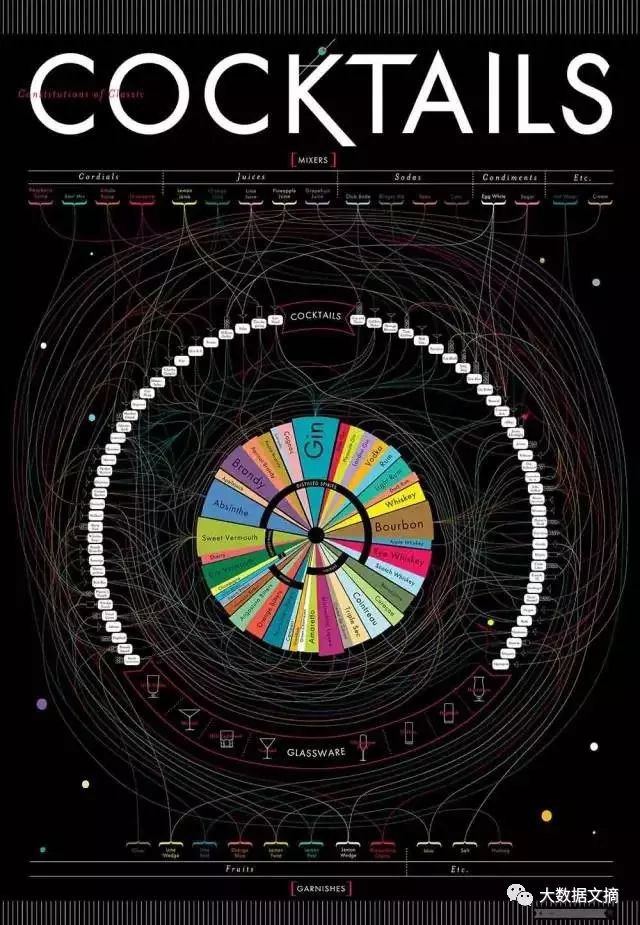
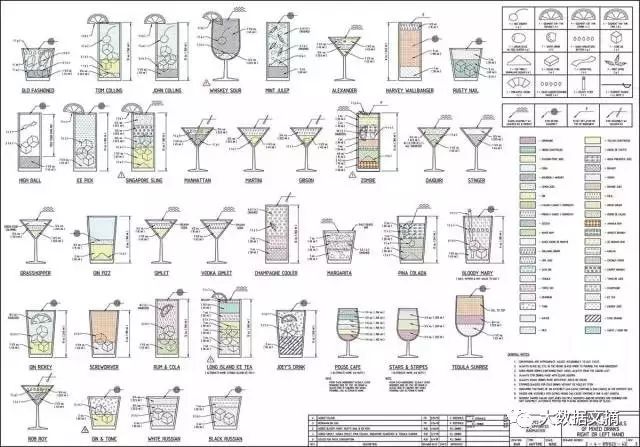
Cocktails by Pop Chart Lab
图解
鸡尾酒
17-
The better life snowflake by Paula Filippone
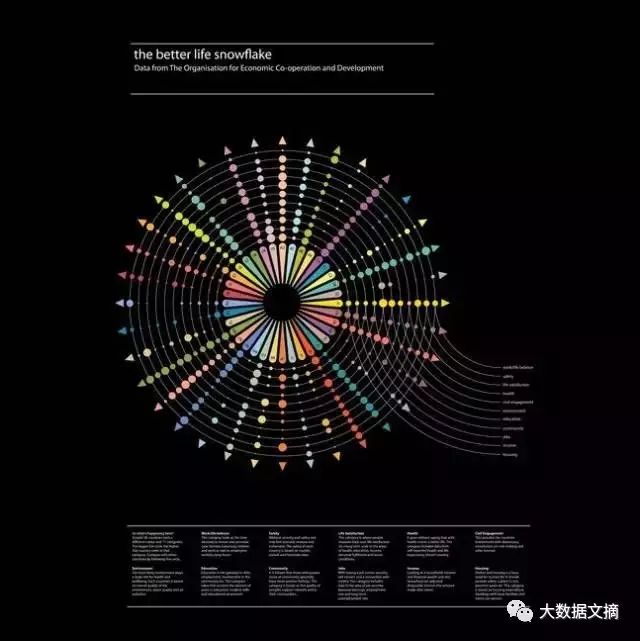
18-
Searching for Peace in Old Age by Hyperakt, Ekene Ijeoma
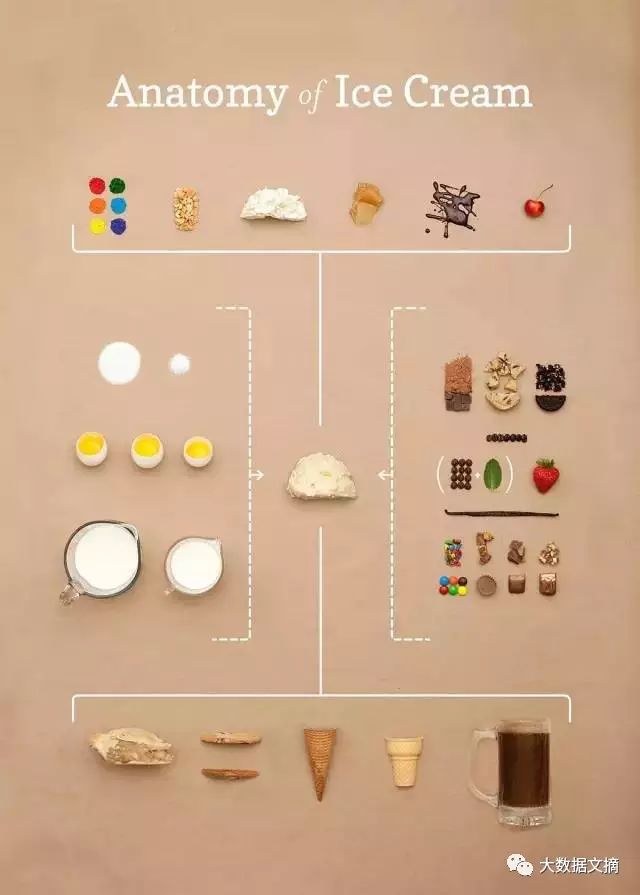
19-
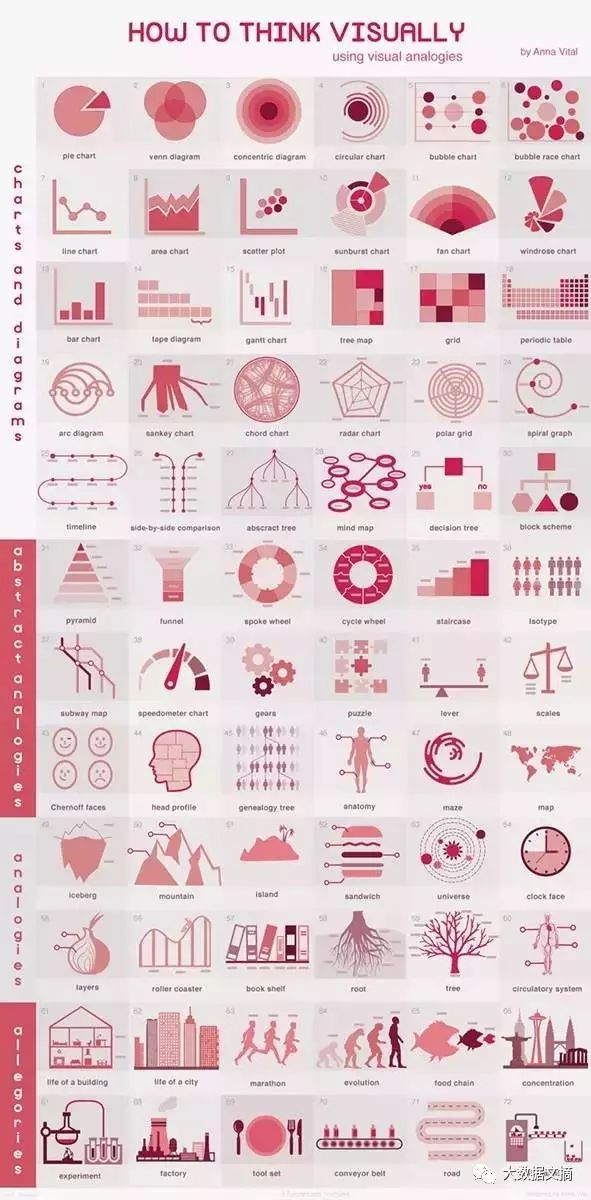
Country Codes by Billy Harkcom
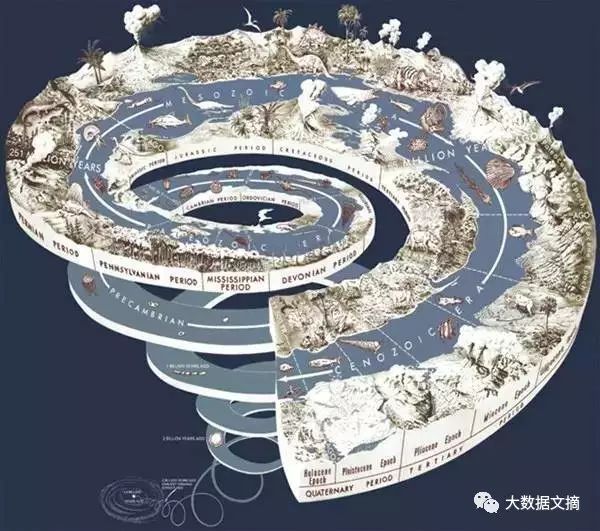
国家代码

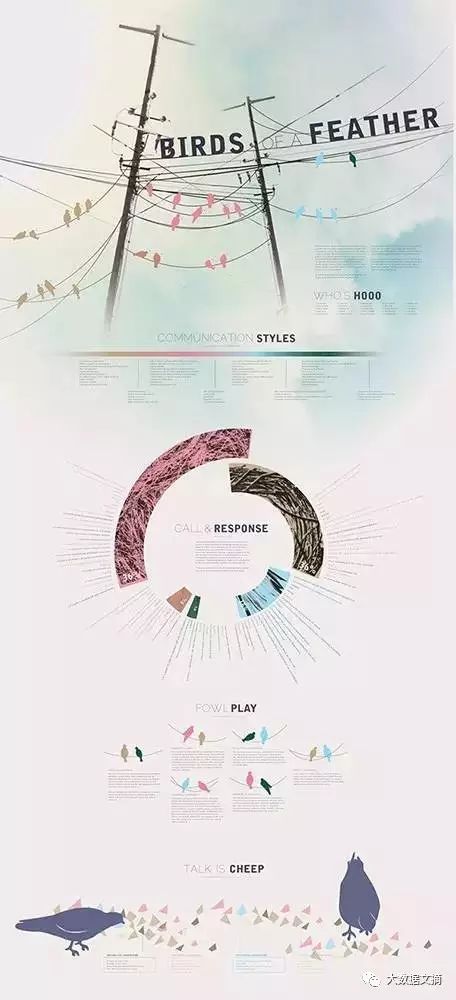
20-
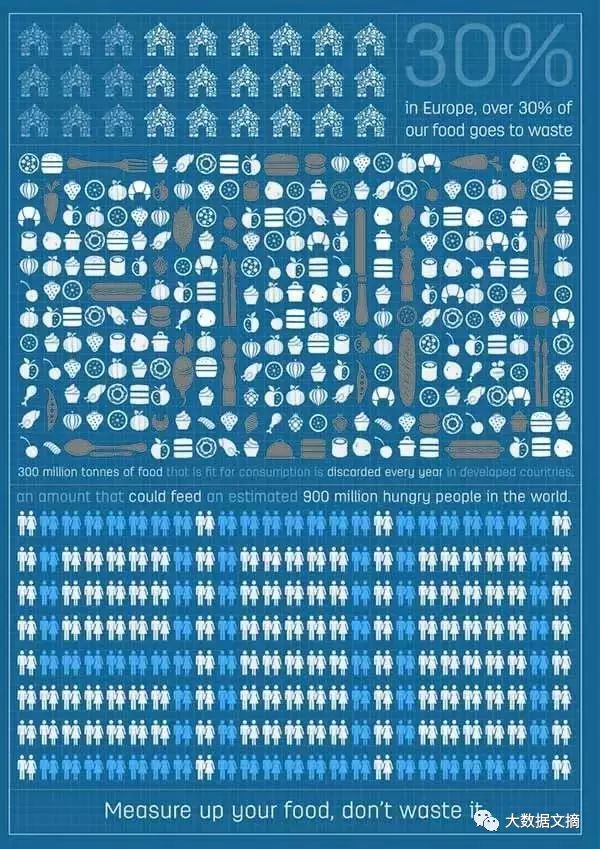
Measure Up Your Food by Phai Dip
计量你的食物
21-
Colour Wheel Calendar 2013 by Ghin Liew
2013彩轮日历
22-
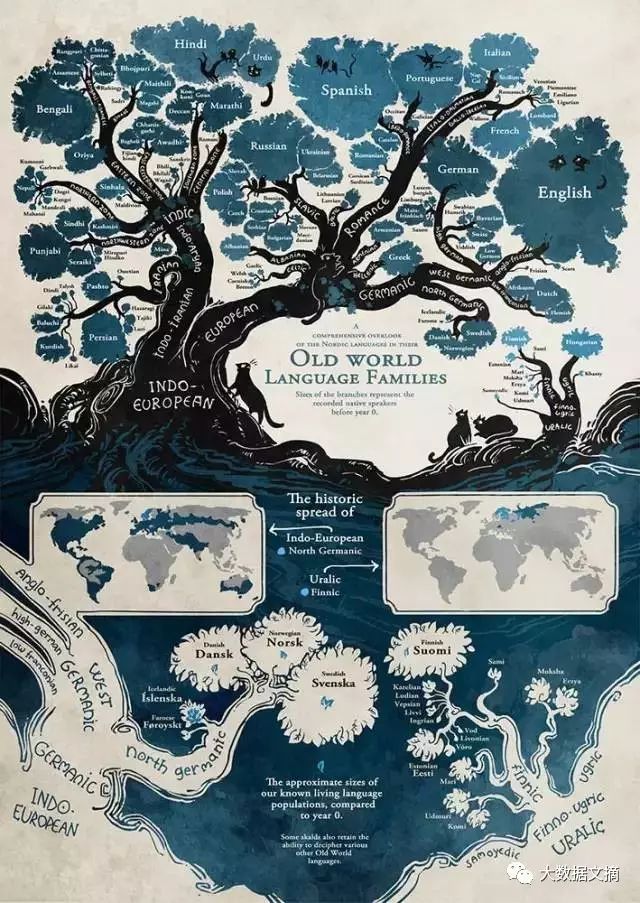
Control of Birth Control by GOOD/Column Five、
节育控制

23-
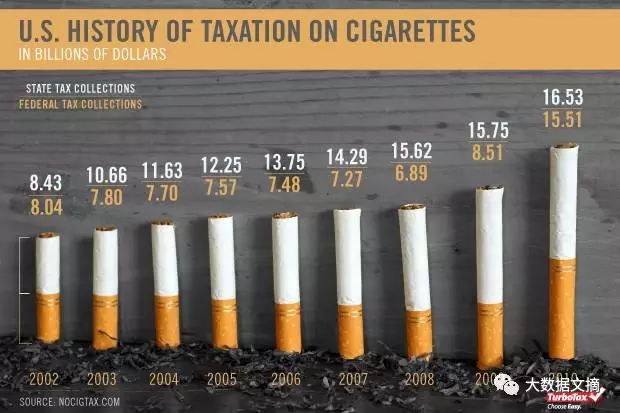
Cigarette Taxes in Photos by Turbo Tax
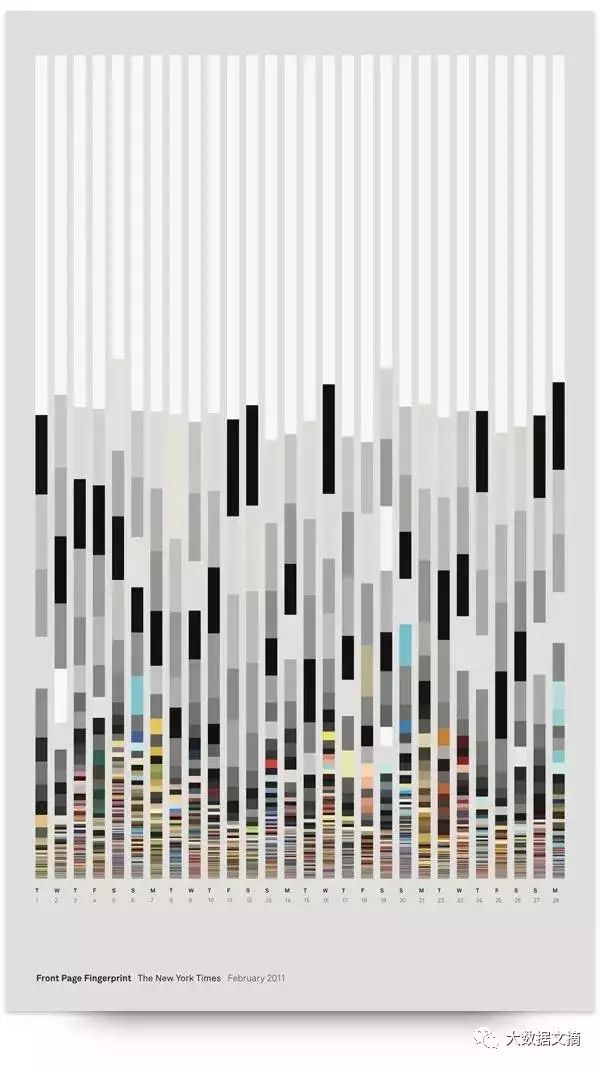
香烟税
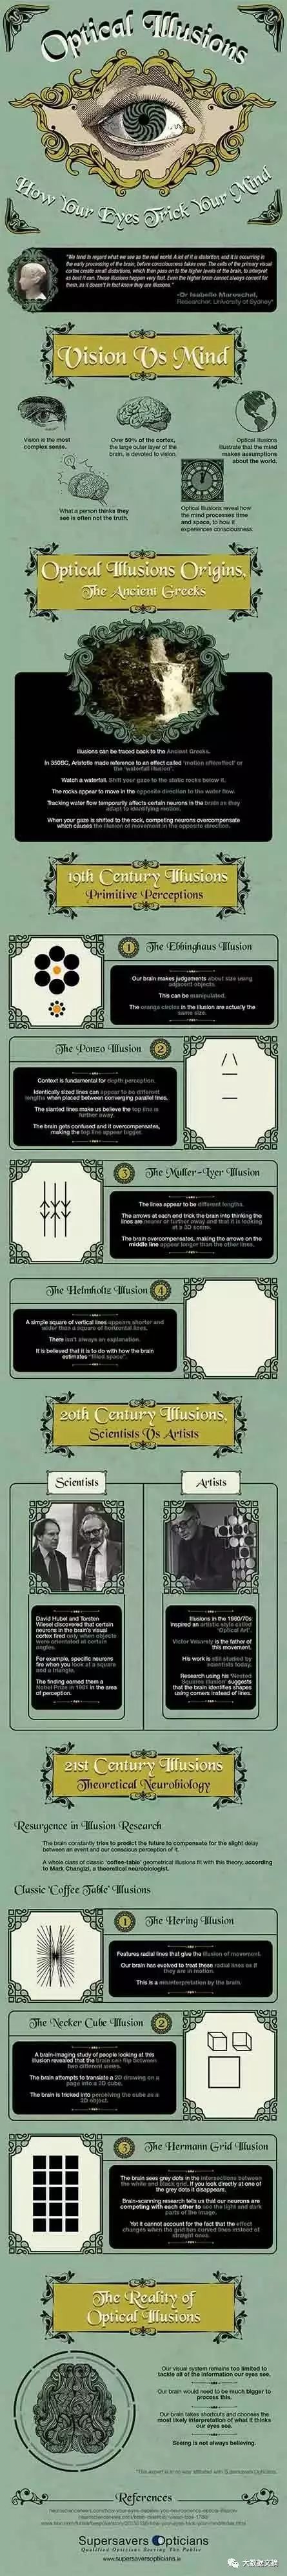
24-
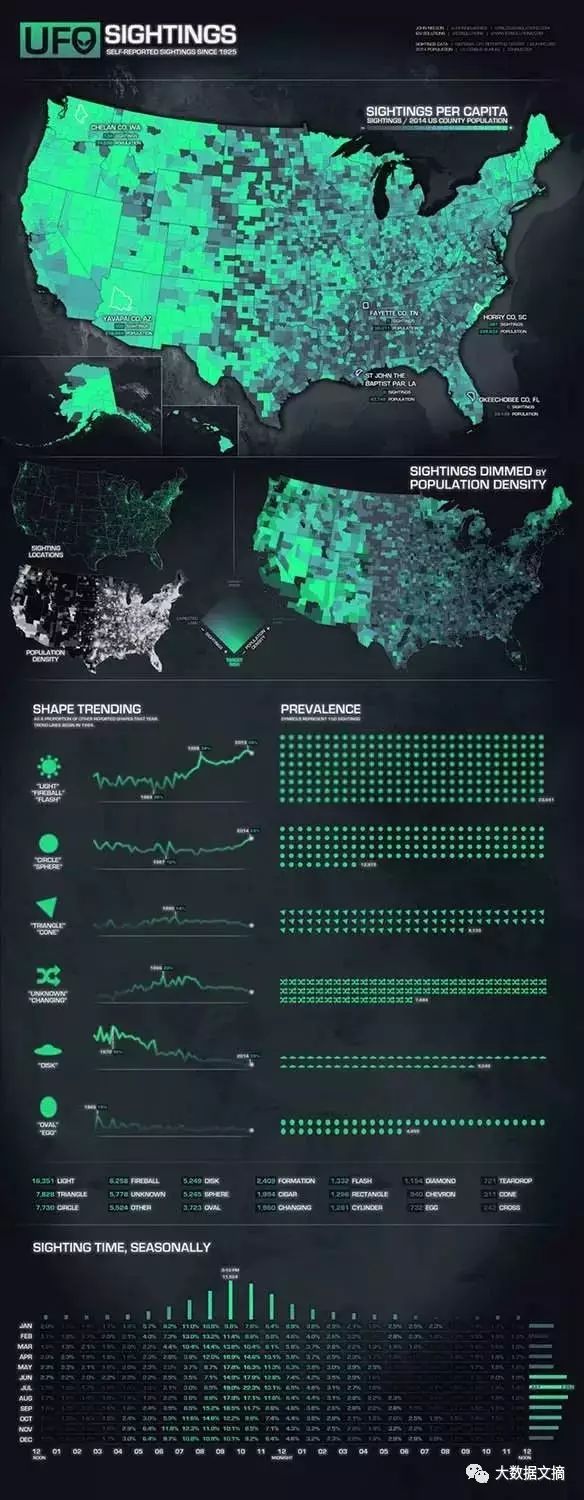
Growth Rings by Alyssa Yeager
年轮

25-
Design x Food by Ryan MacEachern
设计某种食物

26-
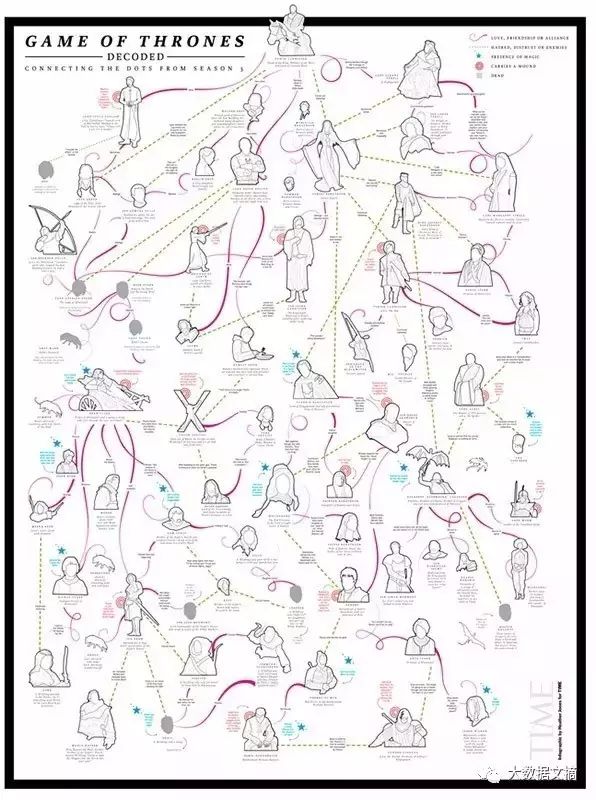
Game of Thrones Decoded: Connecting the Dots from Season 3 by Time
权力的游戏解析:自第三季的连接点
27-
Rain Drops – 25 years precipitation in Eindhoven by Studio Terp
近25年埃因霍温的降水

28-
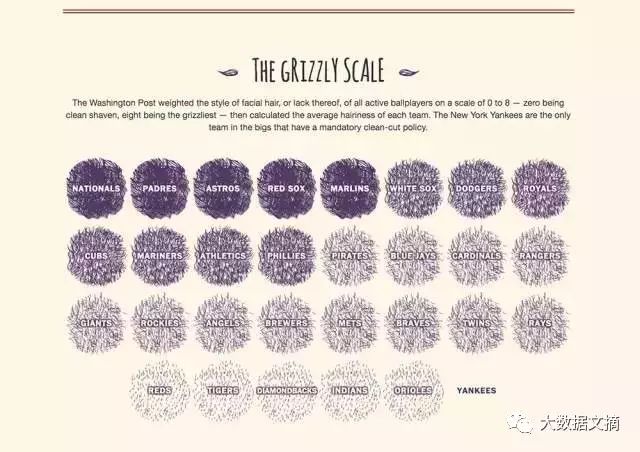
Beards by The Washington Post
胡须
29-
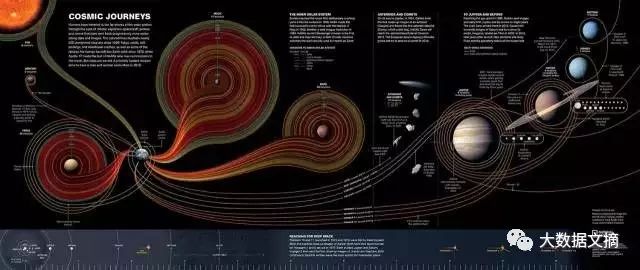
Fifty Years of Exploration by National Geographic
50年来的探索
30-
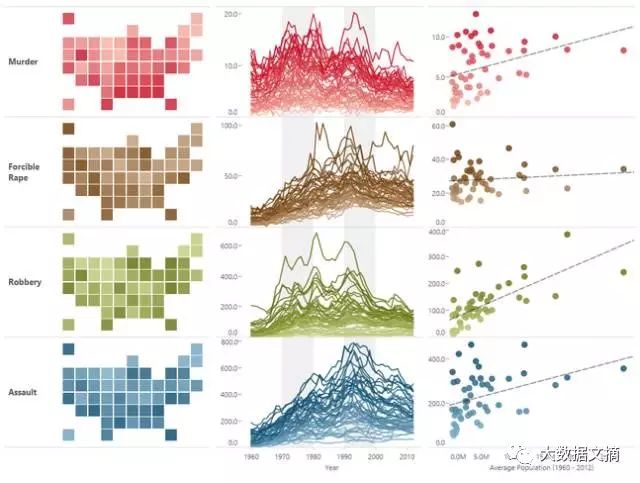
50 Years of Crime by Shine Pulikathara
50年来的犯罪
31-
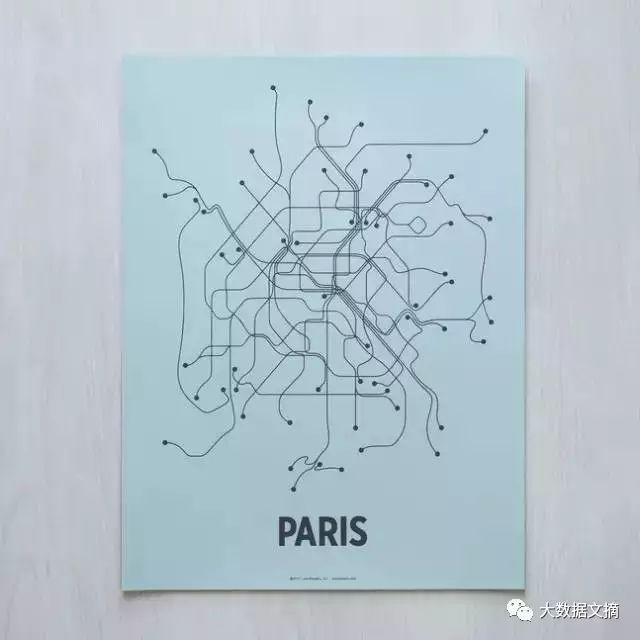
Paris Line Poster by Cayla Ferari & John Breznicky
巴黎地铁线路
32-
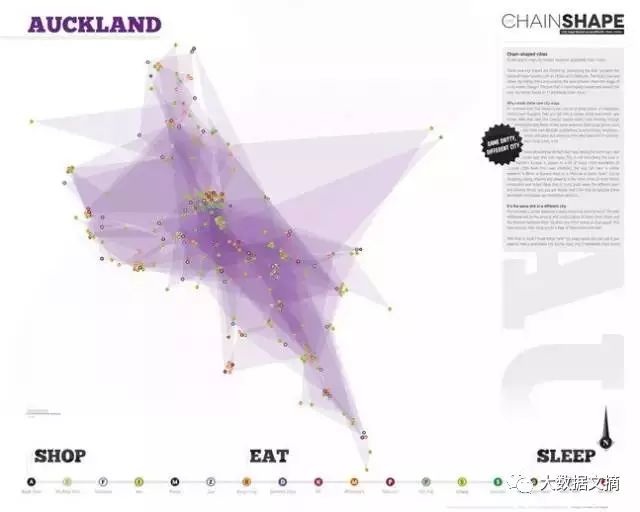
Chain-shaped Cities by Erik Wiegers
城市链条
33-
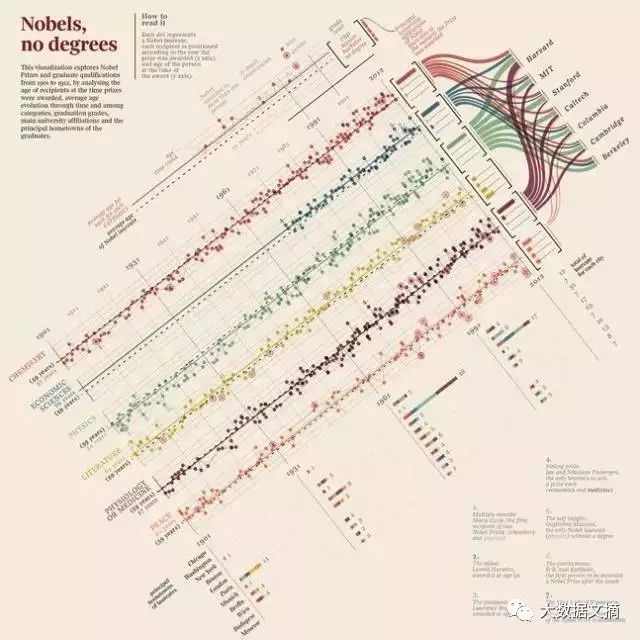
Nobels, No Degrees by Accurat
诺贝尔奖,没有学位的
34-
To See And Hear by Owen Herterich
看到和听到
35-
Color and Space by Jotun
色彩和空间
36-
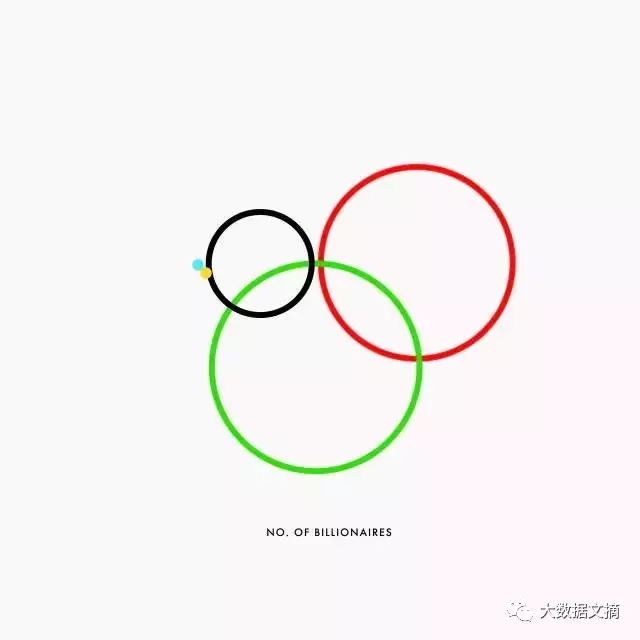
Billionaires by Kim Albrecht
亿万富翁
37-
Digital City Portrait – London by Brendan Dawes
城市的数字肖像

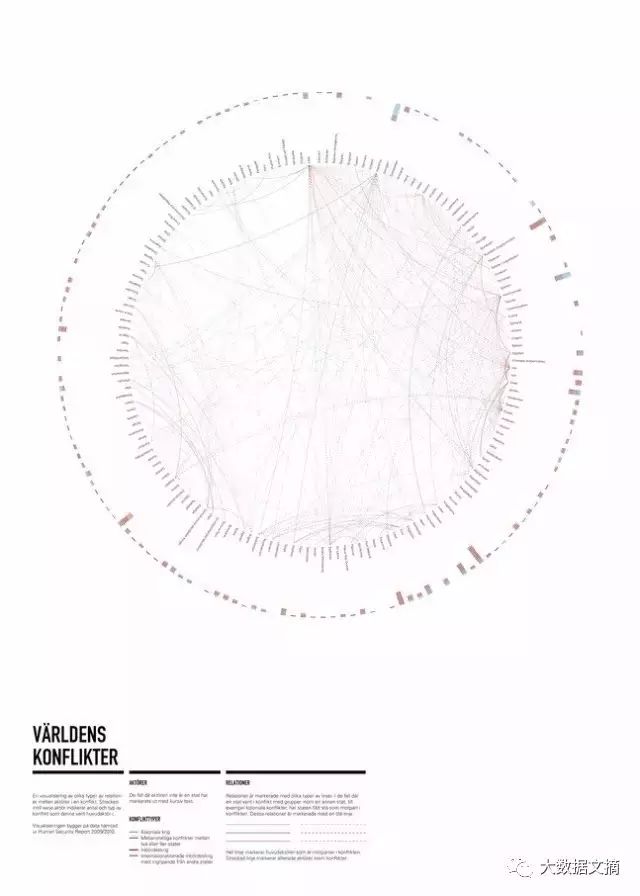
38-
Visualizing Conflicts by Lisa Sigebran
可视化的冲突
39-
Weather Radials by Timm Kekeritz
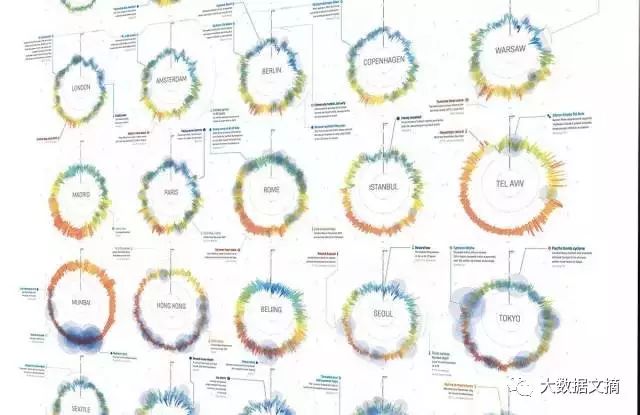
40-
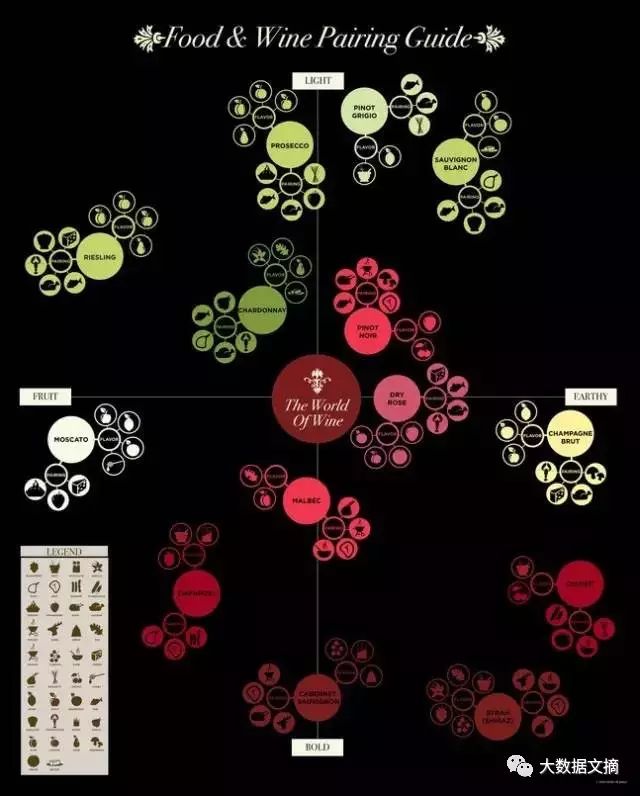
Food and Wine Pairings by Hazel Maria Bala
食物和葡萄酒的搭配
41-
Good Day Sunshine Calendar by Studio Una
阳光灿烂的好日子日历
42-
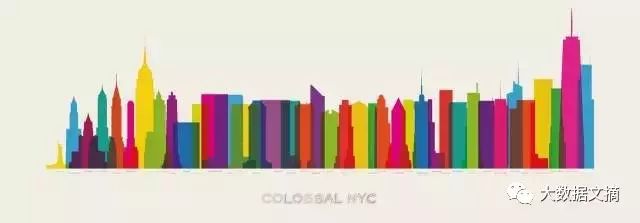
Colossal NYC by Yoni Alter
大纽约
43-
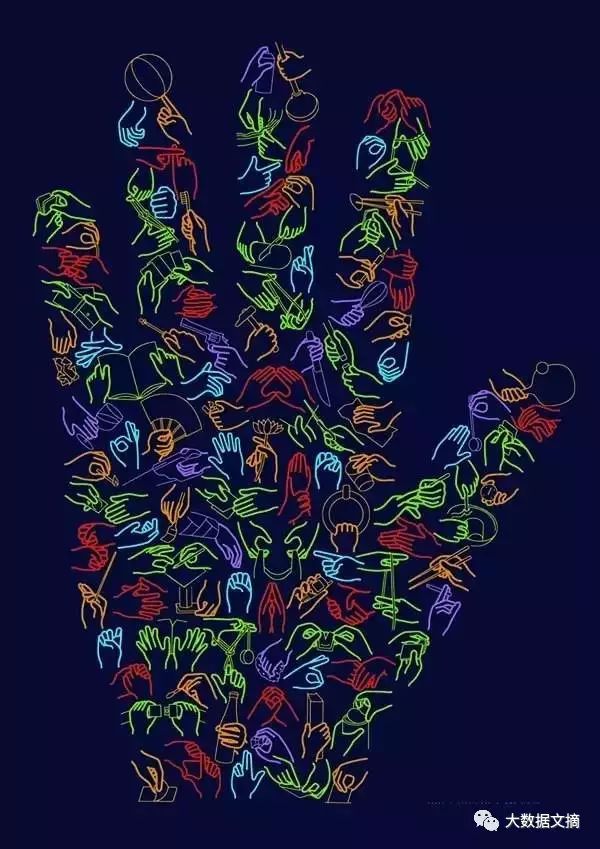
H-AND-S. Hand Signs by Jean-Benoit Levy, Diana Stoen
h-and-s.手势
44-
Movie Loogotypes by Alexey Larchenkov
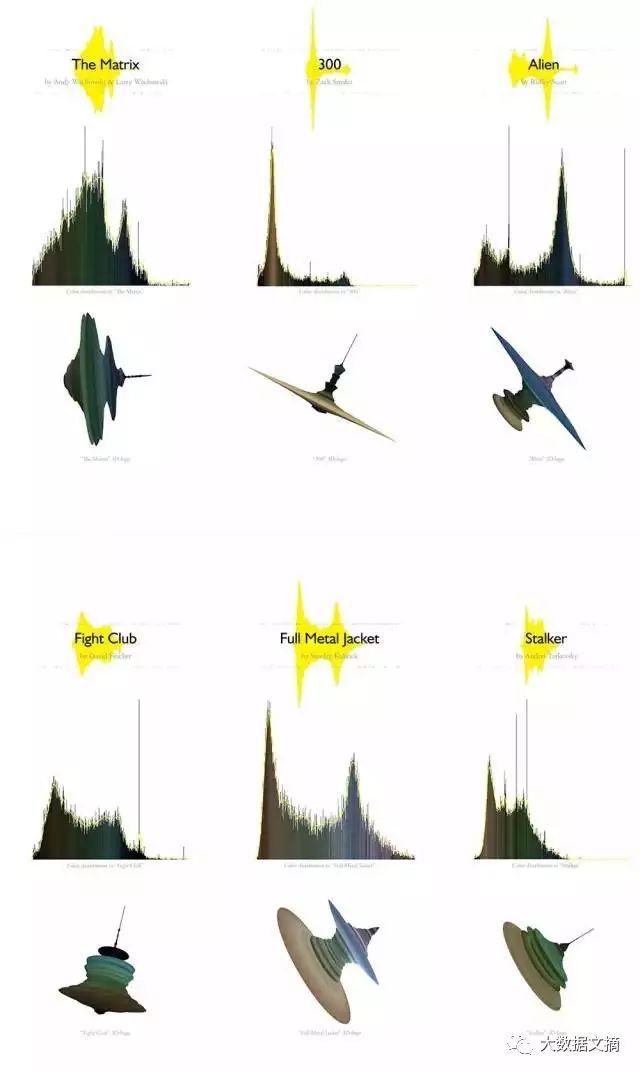
45-
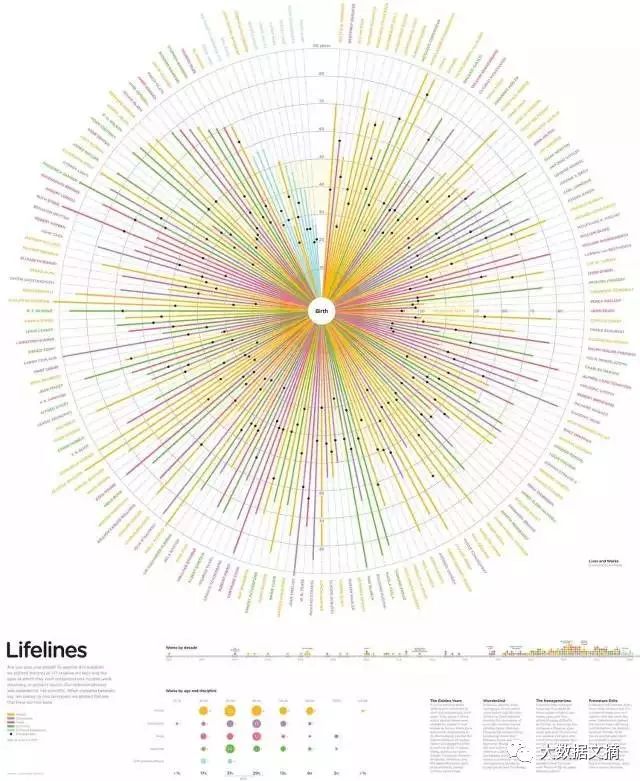
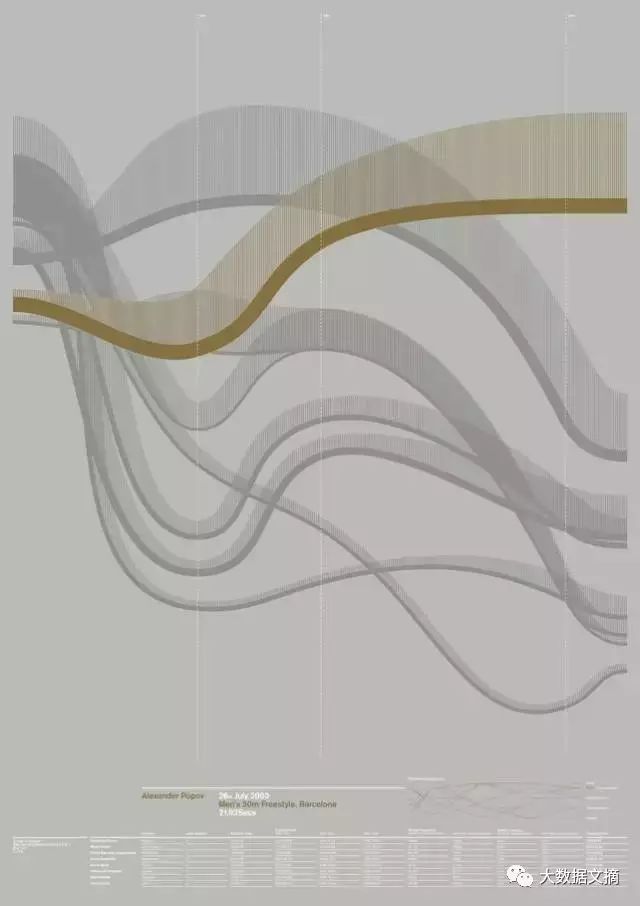
Lifelines by Oliver Uberti
生命线
46-
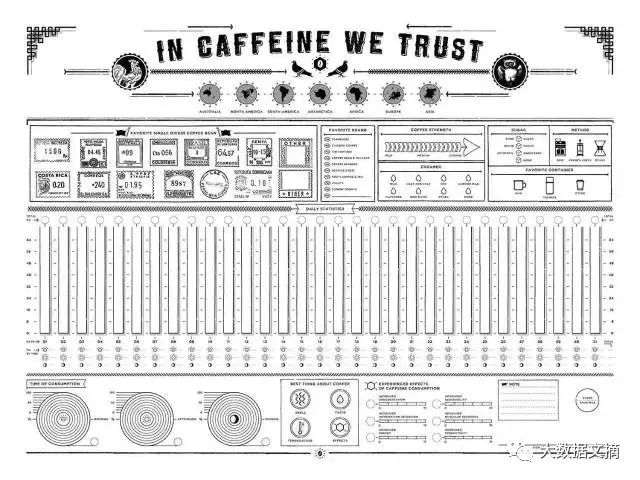
In Caffeine We Trust by Column Five
47-
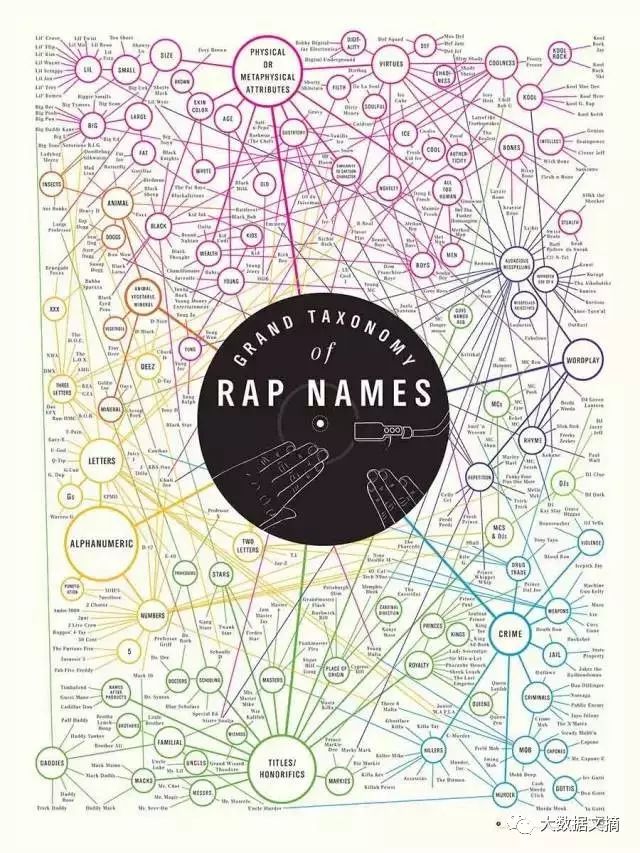
Grand Taxonomy of Rap Names by Pop Chart Labs
说唱名字的大分类
48-
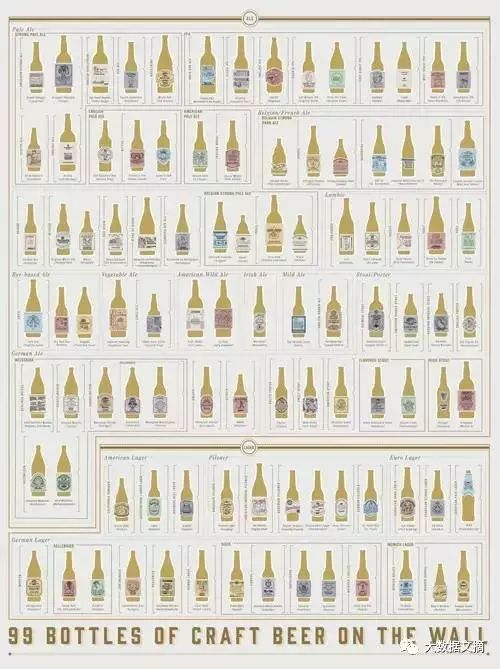
99 Bottles of Craft Beer on the Wall by Pop Chart Labs
墙上的99瓶工艺啤酒
49-
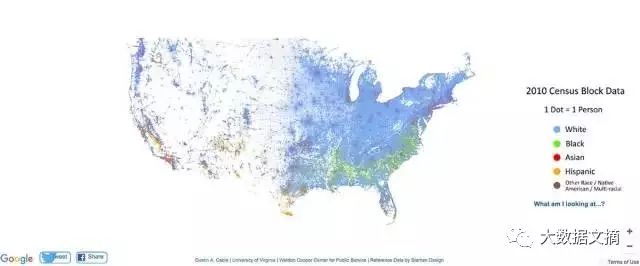
The Racial Dot Map by Dustin Cable
种族分布点地图
50-
CAD Drinks by Shaan Hurley
用CAD绘制的饮料剖面
51-
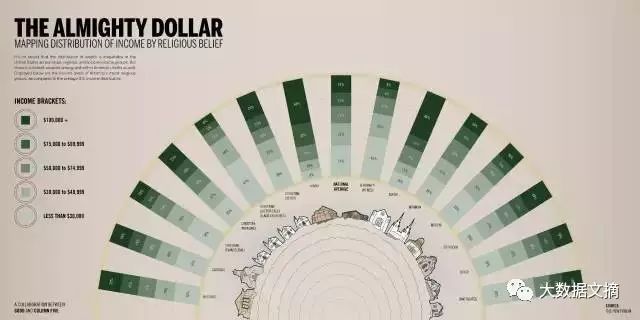
The Almighty Dollar by GOOD
万能的美元
52-
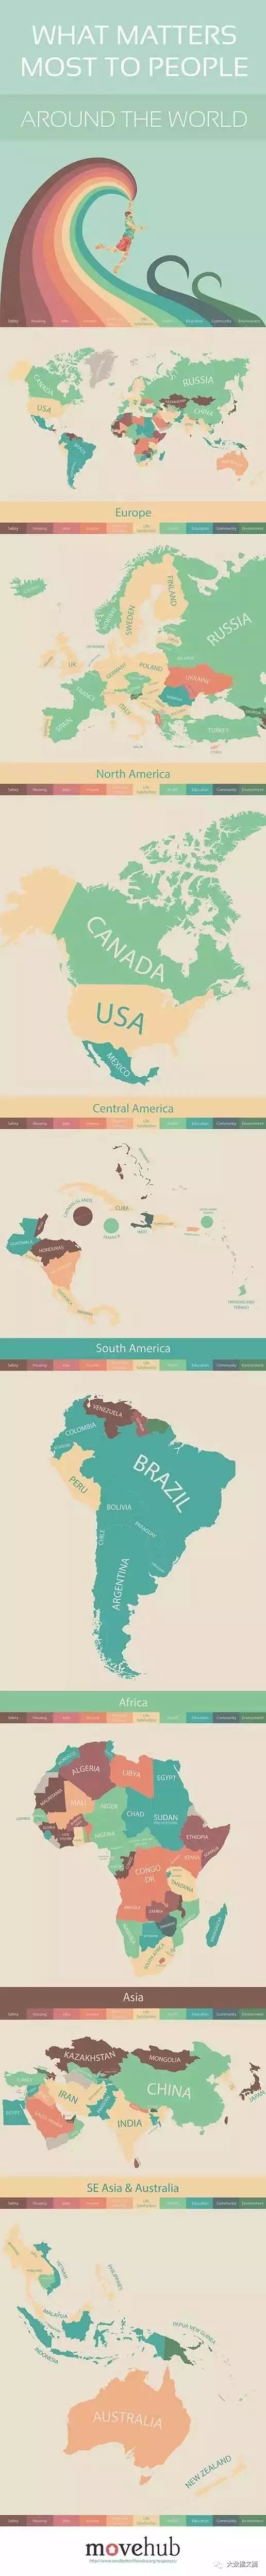
What Matters Most to People Around the World by Movehub
对人来说世界上最重要的是什么
53-
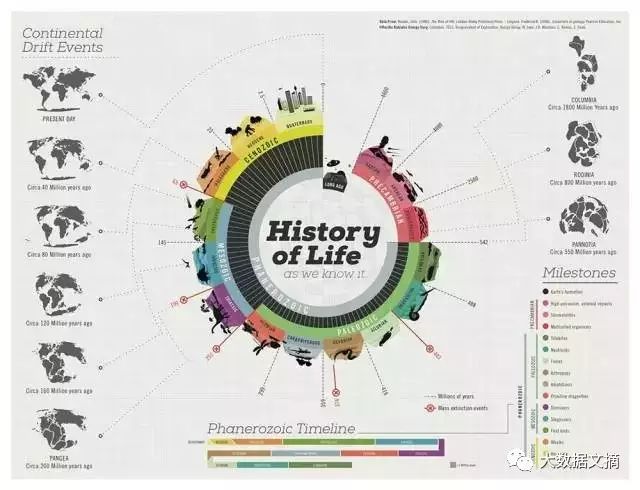
History of Life by Juan David Martinez
生活史
54-
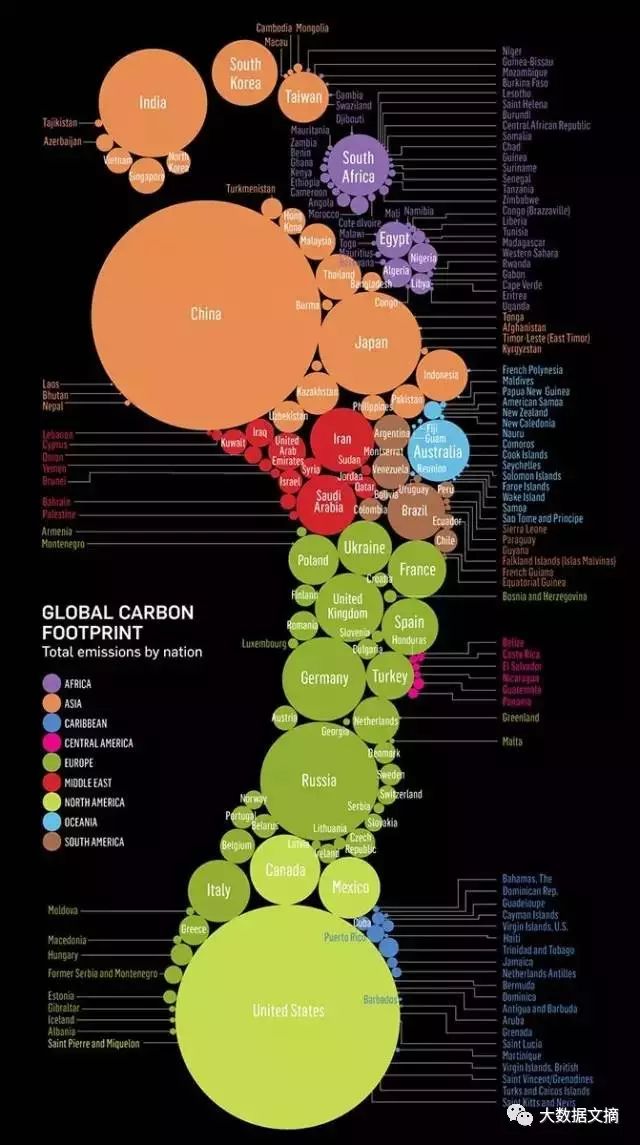
Global Carbon Footprint, by Nation by Miller Mc-Cune
全球的碳足迹
55-
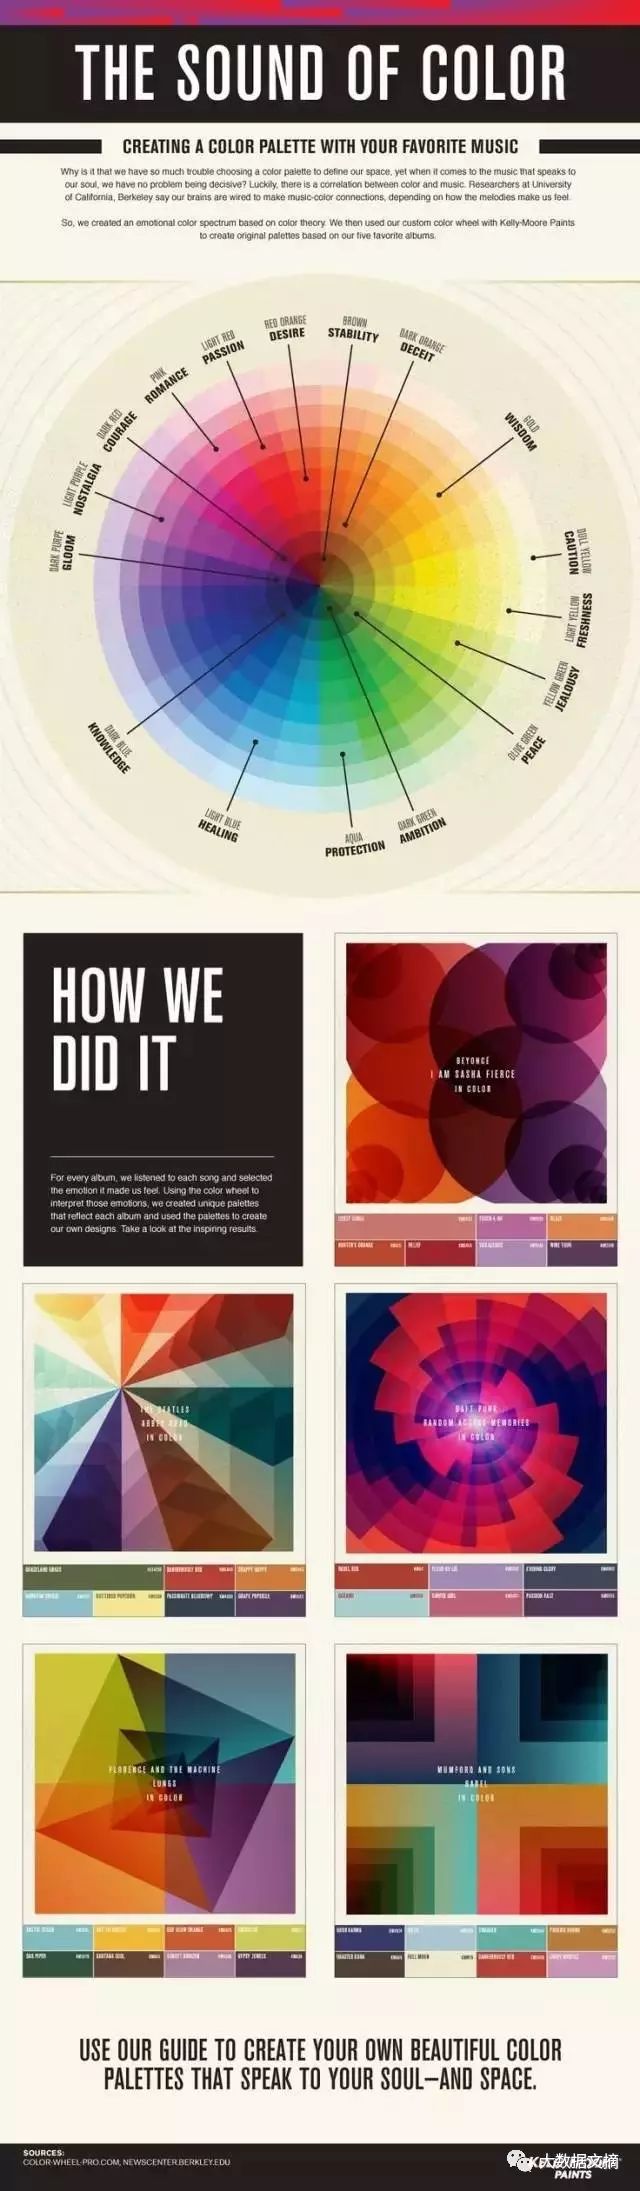
The Sound of Color by Kelly-Moore Paints
色彩之声
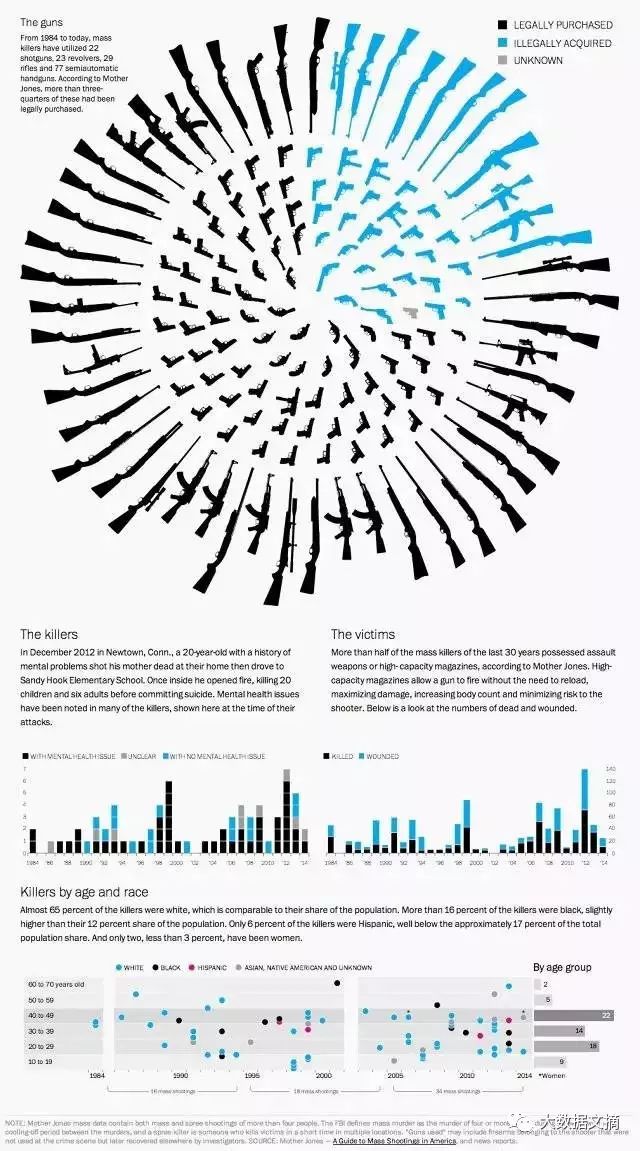
56-Weapons and Mass Shootings by The Washington Post
武器和大规模枪击案
57-
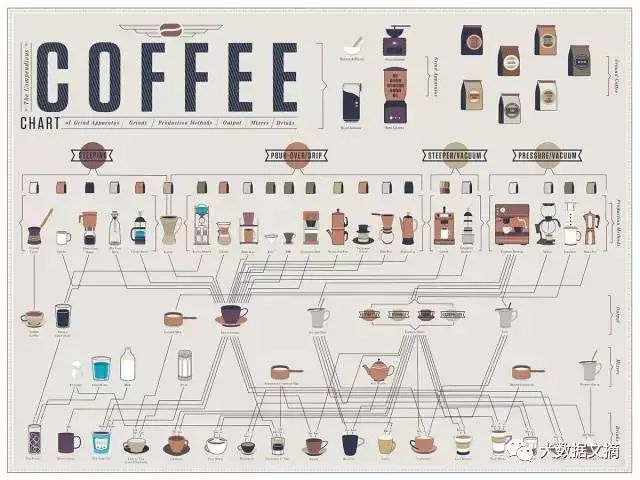
The Compendious Coffee Chart by Pop Chart Labs
简要的咖啡图
58-
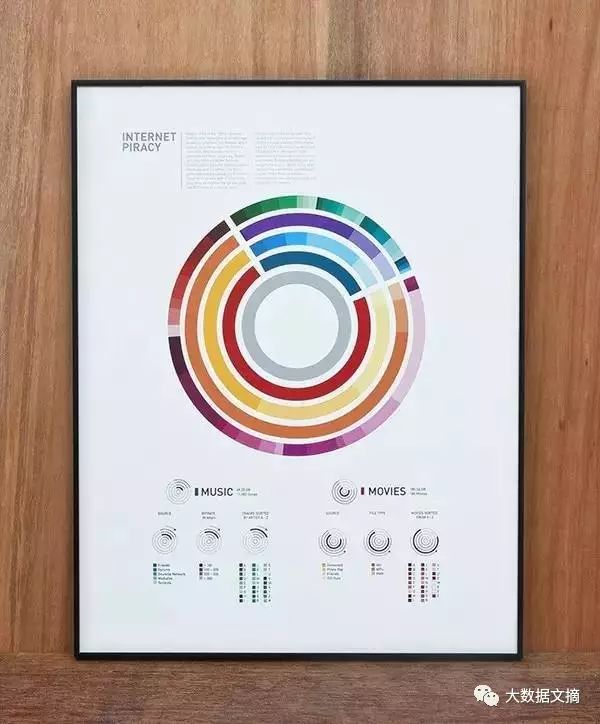
Internet Piracy by Bryce Praught
互联网盗版
59-
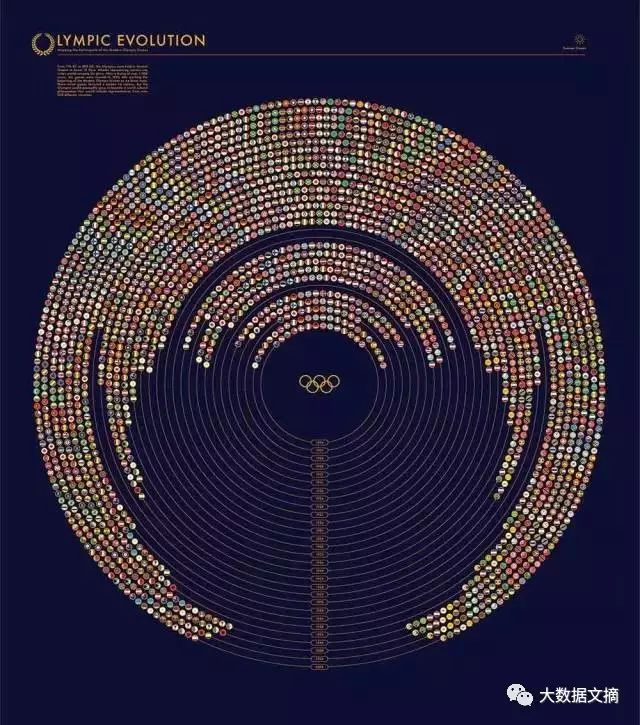
Olympic Evolution by Alicia Korn
奥运会的演变
60-
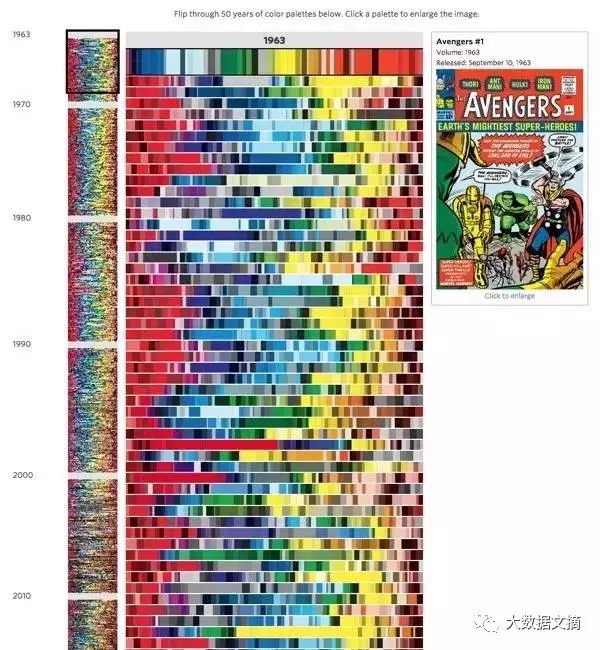
50 Years of ‘Avengers’ Comic Book Covers Through Color by The Wall Street Journal
50年来“复仇者”的漫画书封面的颜色
61-
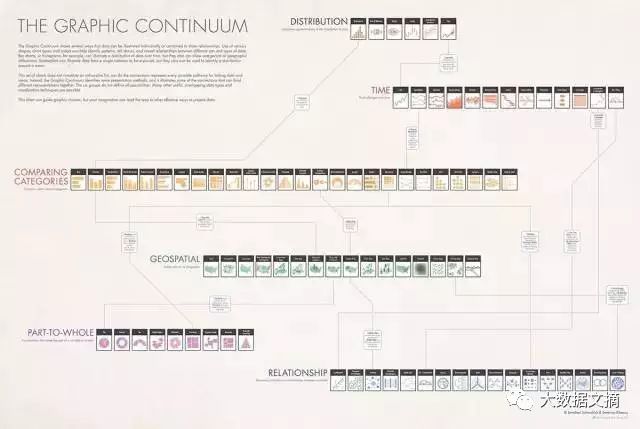
The Graphic Continuum by Jonathan Schwabish
图形的连续性
62-
The Anatomy of Ice Cream by Anthology Magazine
冰激凌的解剖
63-
How to Think Visually by Anna Vital
64-
The Geologic Time Spiral by USGS
地址时间螺旋
65-
Birds of a Feather by Cindy Tsui
66-
Seven Summits by Audree Lapierre
7座高峰

67-
Universo de Emociones by Palaugea
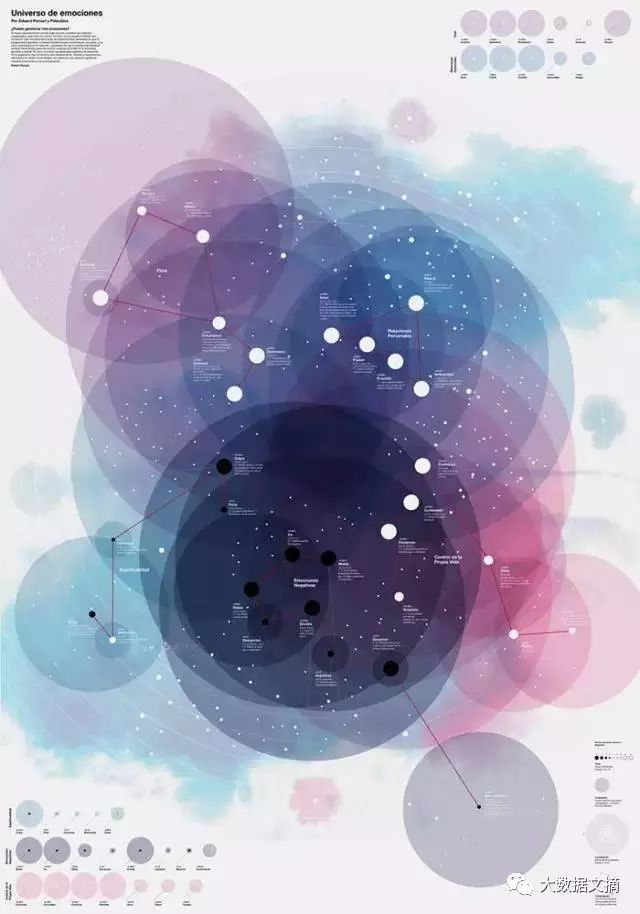
68-
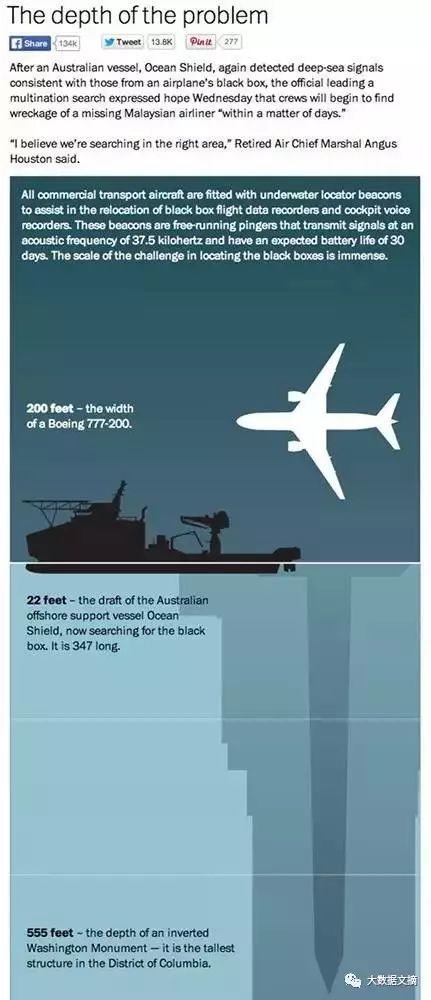
The Depth of the Problem by The Washington Post
问日的深度
69-
The Sum of Parts by SCMP Graphic

70-
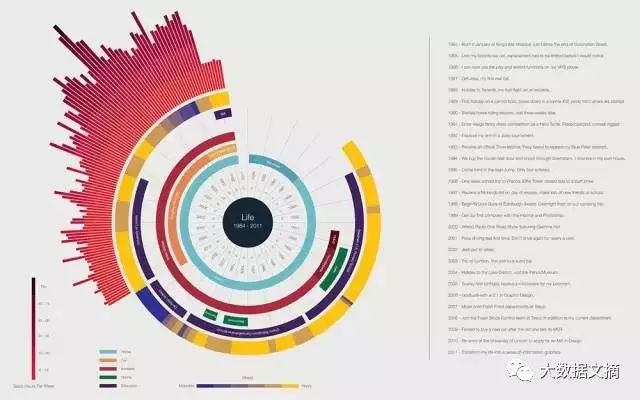
Life in Data by Ben Willers
生活中的数据
71-
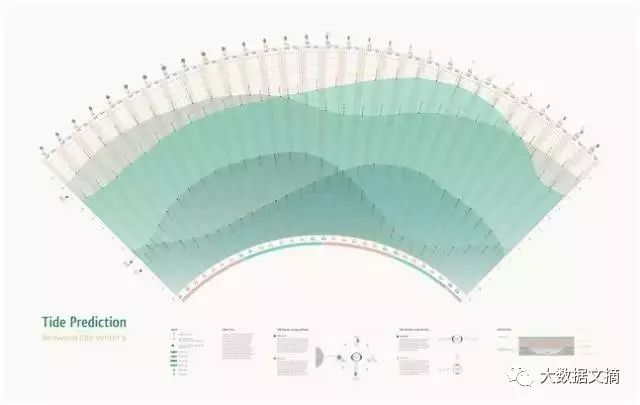
Tide Predictions by Joan Ang
潮汐预报
72-
Old World Language Families by Hive Mill
西方语言之树
73-
Front Page Fingerprint by Derek Chan
纽约时报2011年头版的色彩分布
74-
Gear Timeline by Chen-Wen Liang
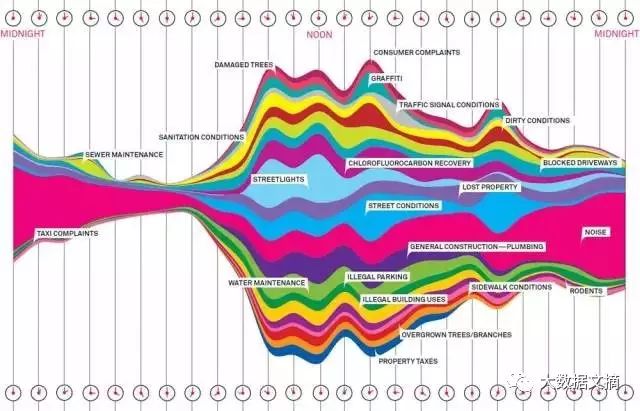
75-
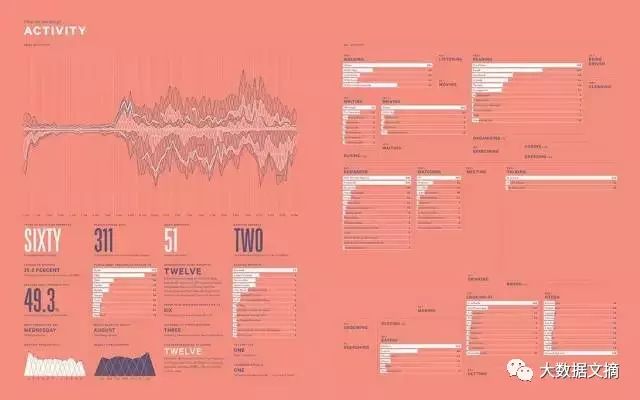
What a Hundred Million Calls to 311 Reveal About New York by Wired
76-
OrgOrgChart by Justin Matejka & George Fitzmaurice
大公司组织结构图
77-
Optical Illusions by Supersavers Opticians
光学错觉
78-
UFO Sightings by John Nelson, IDV Solutions
UFO目击事件
79-
Popification of the Top 40 by Gavin Potenza
80-
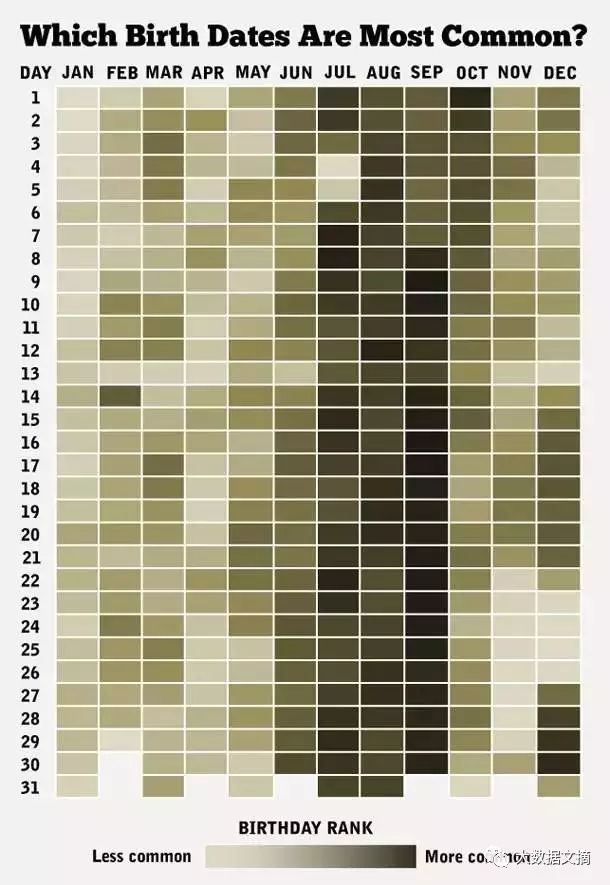
How Common Is Your Birthday by Matt Stiles
生日概率统计
81-
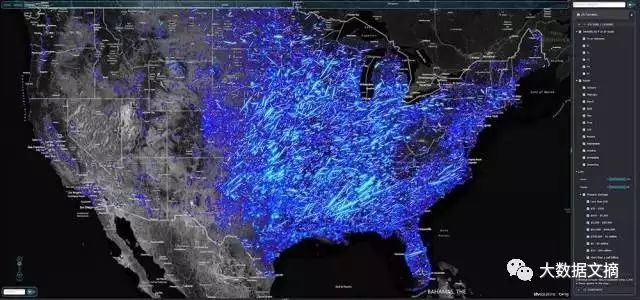
Tornado Tracks by IDV Solutions
龙卷风轨迹
82-
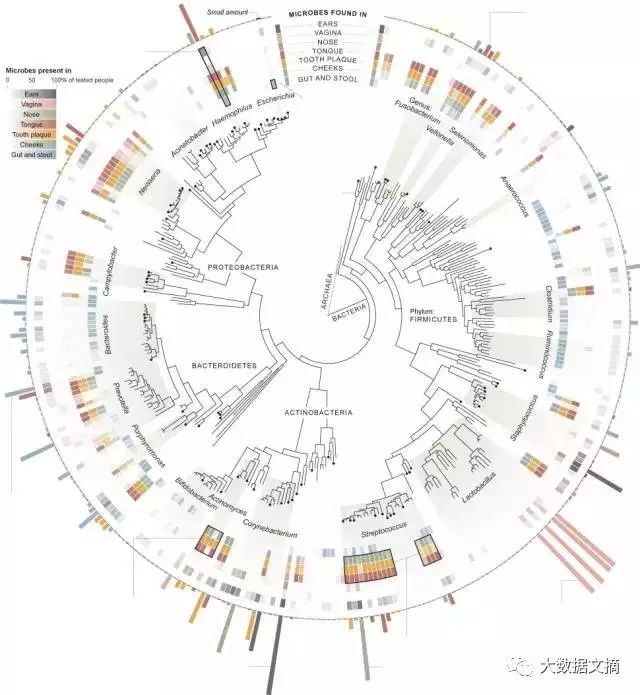
Invisible Residents by The New York Times
隐居者
83-
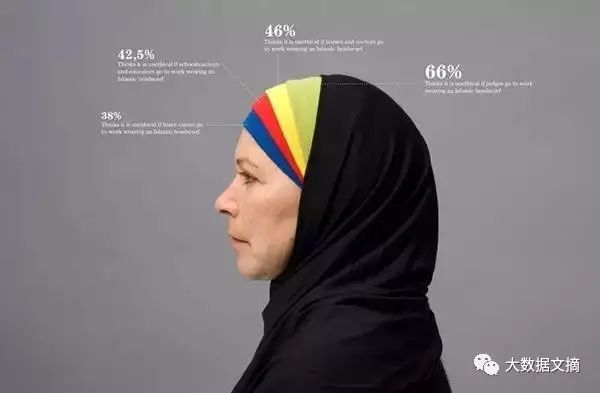
Information graphics in Context by Peter Ørntoft
信息图形可视化
84-
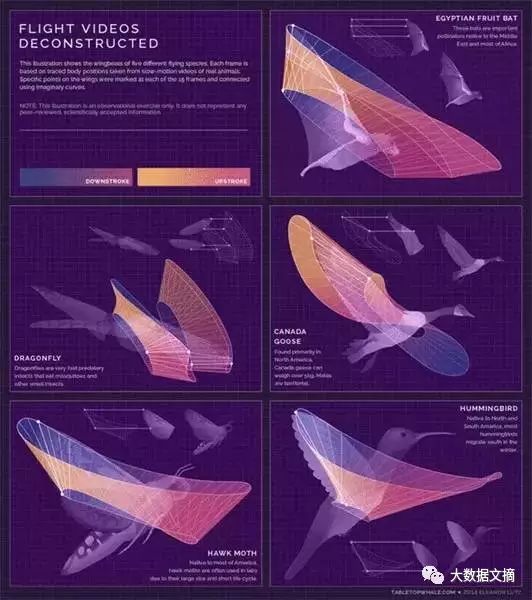
Flight Videos Deconstructed by Eleanor Lutz
不同动物在飞行时翅膀的飞行轨迹
85-
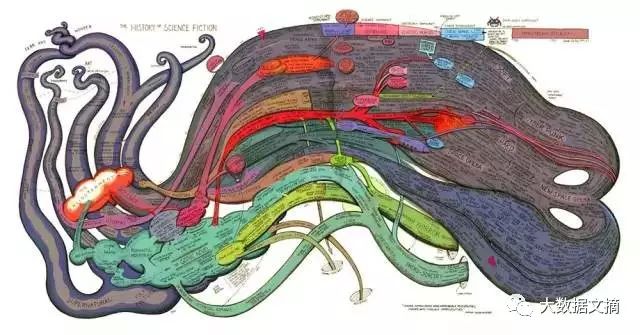
The History of Science Fiction by Ward Shelley
科幻小说史
86-
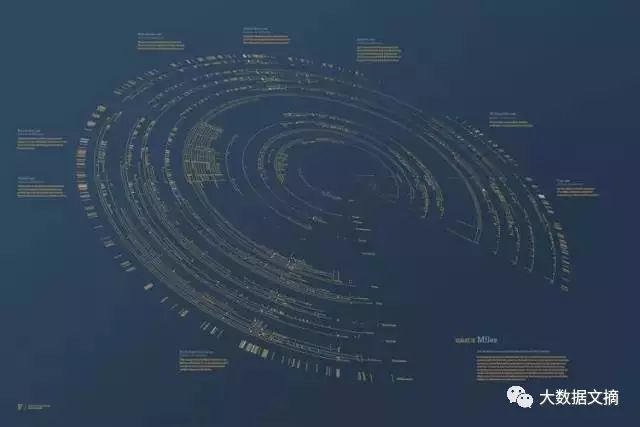
Scaled in Miles by Fathom
87-
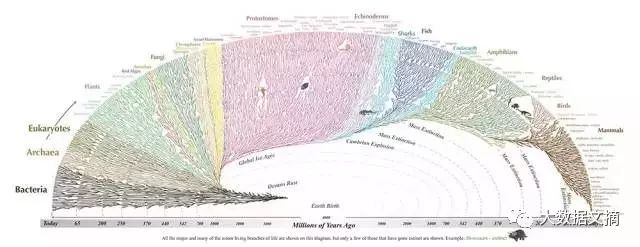
Tree of Life Leonard Eisenberg
生命之树
88-
The Art of Performance by Accept and Proceed
表演艺术
89-
Oceania europe americas africa asia by Gustavo Sousa
大洋洲 欧洲 美洲 非洲 亚洲
90-
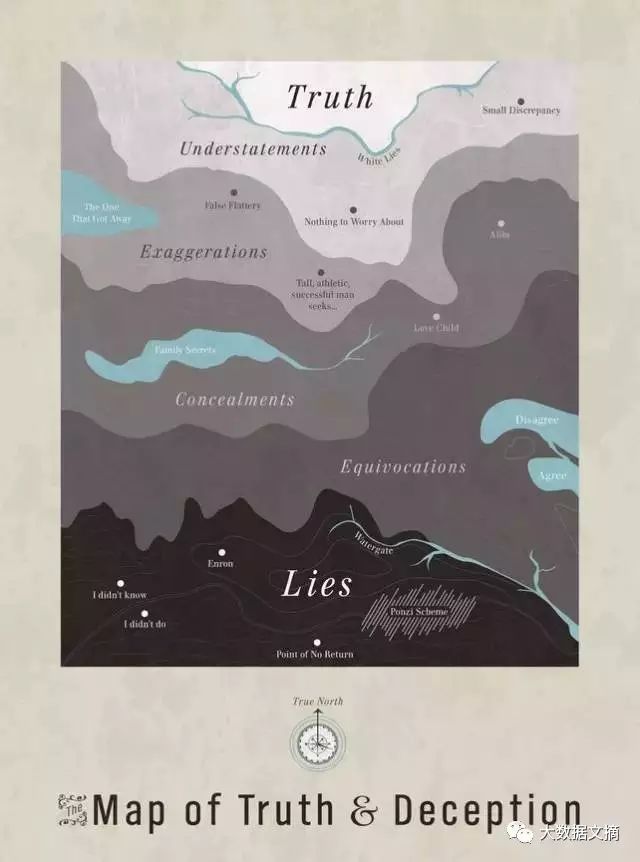
Map of Truth and Deception by Ben Gibson
真理与欺骗地图
91-
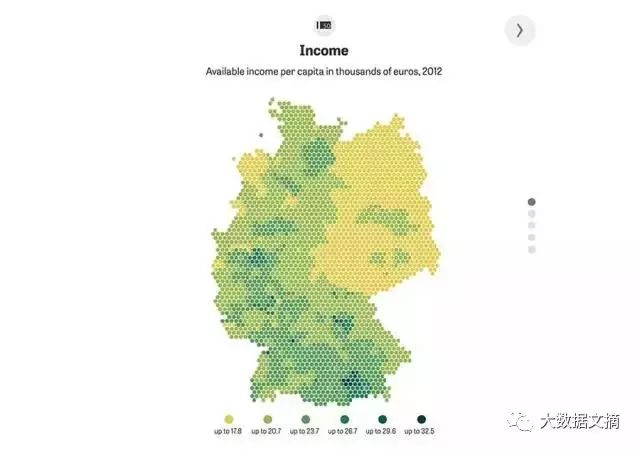
German Unification by Zeit Online
德国统一
92-
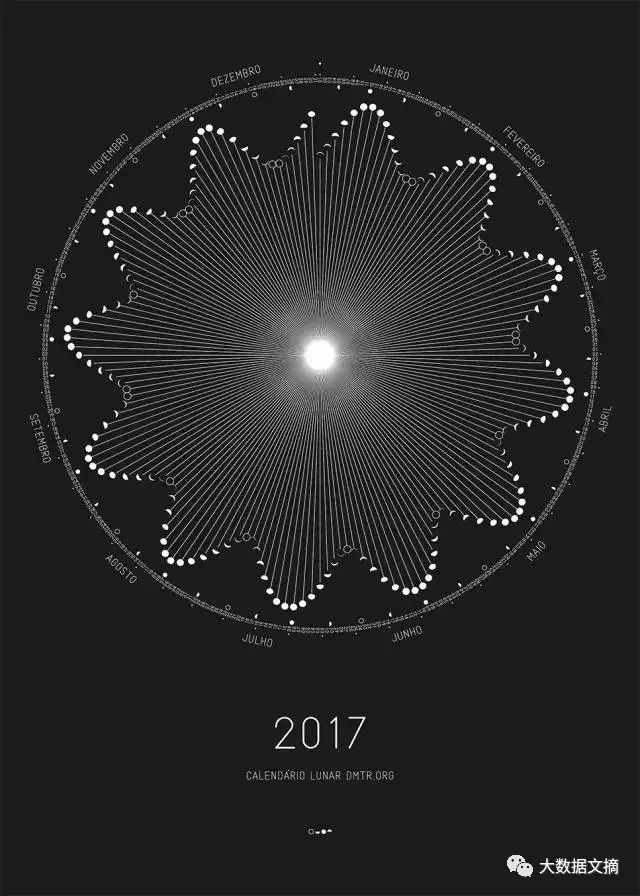
Lunar Calendar by Dimitre Lima
农历
93-
2
012 Annual Report by Nicholas Felton
年度报告
94-
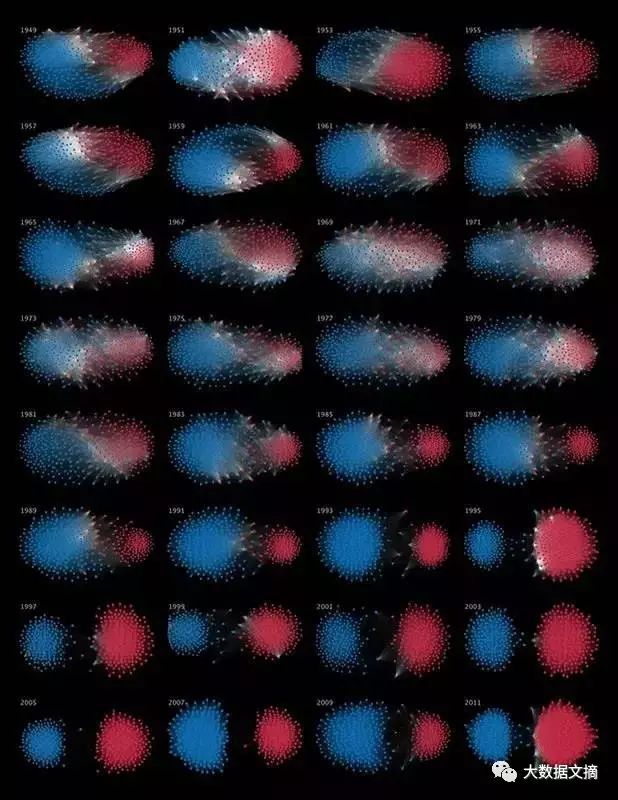
The Rise of Partisanship in the U.S. House of Representatives by Mauro Martino, Clio Andris
美国众议院党派之争的兴起
95-
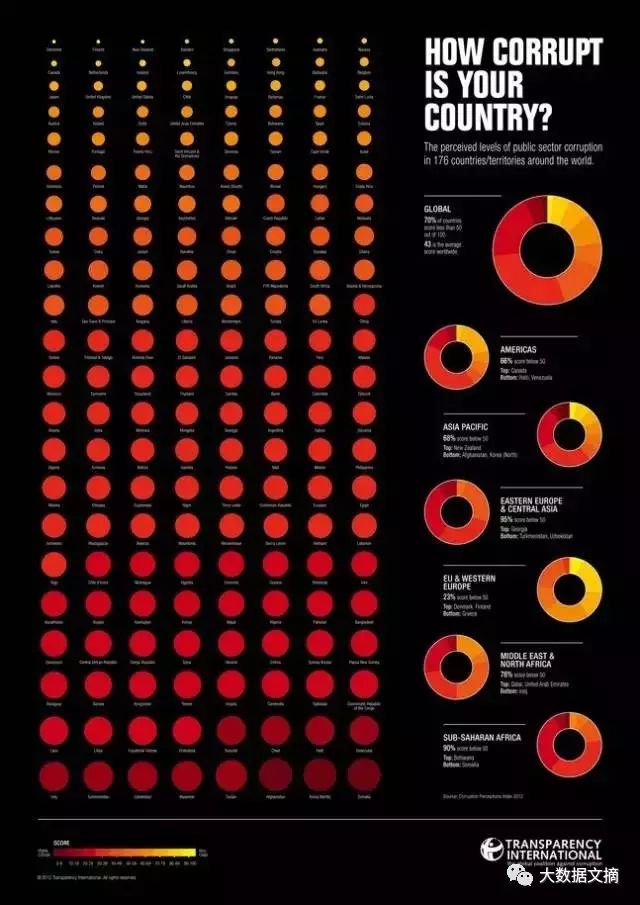
How Corrupt is Your Country by Sophie Everett
全球各国腐败度
96-
Dead Man Walking by GOOD Magazine

97-
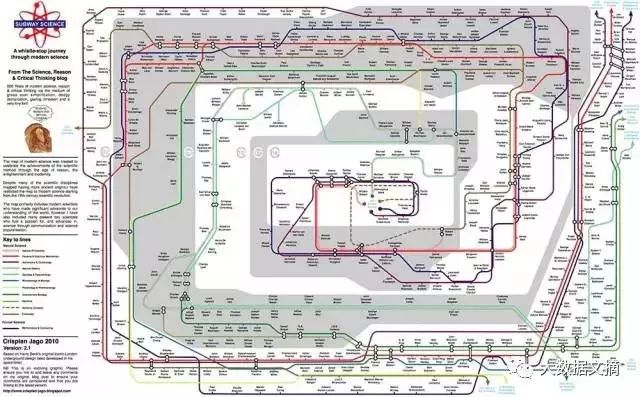
Subway Science by Crispian Jago
科学地铁
98-
Evolution of Storage by Curtiss Spontelli
存储的进化史

99-
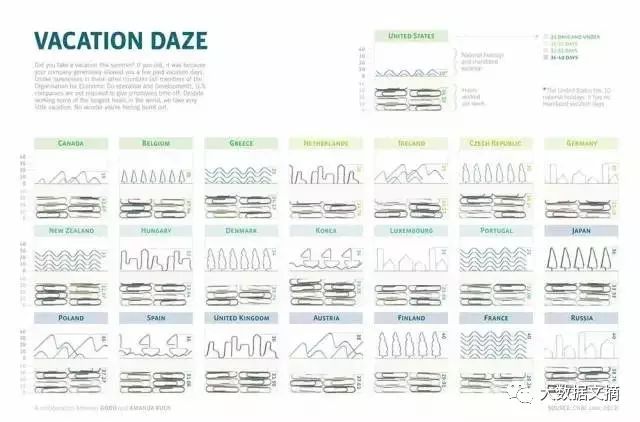
Vacation Daze by GOOD Magazine
度假发呆
100-
Shark Attack by Ripetungi
鲨鱼攻击

其实,这种信息可视化的展现不仅是我们大脑所喜爱的,更是我们日常所需要的,设计师帮我们更快、更明确、更高效的完成了与大脑的输送。
研究上千张数据图表后 我学到12条可视化的秘密准则 | 附资源