作者
| Aravind Ramalingam @medium
原文 | https://medium.com/analytics-vidhya/how-to-pick-the-optimal-image-size-for-training-convolution-neural-network-65702b880f05
编辑 | AI约读社
在自定义数据集上训练卷积神经网络时,选择正确的图像尺寸至关重要,
因为这将影响模型的训练时间和性能。
此外,我们将学习如何识别数据集是否存在任何问题。
为什么需要选择最优的图像大小来训练?
在我们跳到“如何选择”这一部分之前,让我们先讨论一下选择错误了训练图像尺寸的后果。在我们选择了固
定的
width
和
height
之后,
标准程序是将所有图像的大小调整到这个固定的大小。因此,现在每个图像都落入到两种情况当中。
因此,我们必须选择自己的训练图像尺寸,我们越接近最佳图像大小,效果就越好。
如何获取最佳图像尺寸?
我们将选择合适的最佳训练图像尺寸的步骤分为两步,第一步是可视化数据集中图像大小,第二步是分析数据分布情况选择最佳训练尺寸。
关注公众号,后台回复:图像尺寸,即可获得原文代码
。
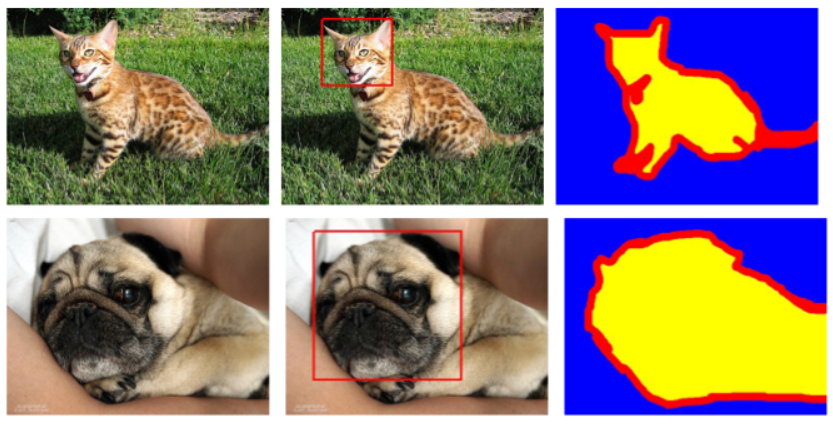
这里我们以
Oxford-IIIT 宠物数据集
为例
数据集链接:
https://www.robots.ox.ac.uk/~vgg/data/pets/
import pandas as pdimport matplotlib.pyplot as pltfrom PIL import Imagefrom pathlib import Pathimport imagesizeimport numpy as np
imgs = [img.name for img in Path(root).iterdir() if img.suffix == ".jpg"]img_meta = {}for f in imgs: img_meta[str(f)] = imagesize.get(root+f)
img_meta_df = pd.DataFrame.from_dict([img_meta]).T.reset_index().set_axis(['FileName', 'Size'], axis='columns', inplace=False)img_meta_df[["Width", "Height"]] = pd.DataFrame(img_meta_df["Size"].tolist(), index=img_meta_df.index)img_meta_df["Aspect Ratio"] = round(img_meta_df["Width"] / img_meta_df["Height"], 2)
print(f'Total Nr of Images in the dataset: {len(img_meta_df)}')img_meta_df.head()
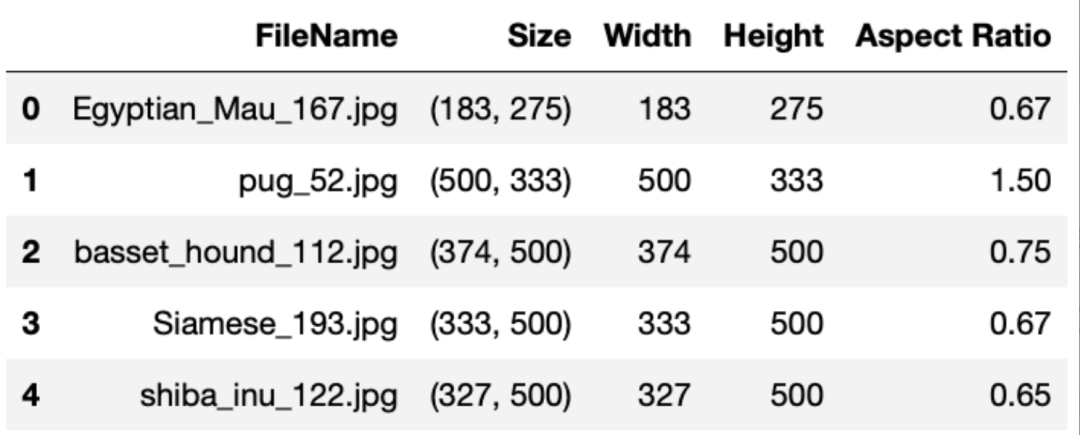
该数据集有 7000 多张不同大小和分辨率的图像,通过下面代码可视化数据集中图像的尺寸分布情况。
fig = plt.figure(figsize=(8, 8))ax = fig.add_subplot(111)points = ax.scatter(img_meta_df.Width, img_meta_df.Height, color='blue', alpha=0.5, s=img_meta_df["Aspect Ratio"]*100, picker=True)ax.set_title("Image Resolution")ax.set_xlabel("Width", size=14)ax.set_ylabel("Height", size=14)

从第一个图中,看起来大多数图像的分辨率小于 500 x 500。放大后,我们可以清楚地看到图像尺寸聚集在 300 或 500 左右。我对这个数据集的建议是开始训练神经网络图像大小为 300 并逐渐增加到 400 并以大小为 500 完成。
这样,对于不同的图像分辨率,该模型都具有较好的泛化能力。
检查错误的数据
1.如果我们可以在检查图中的点的同时看到底层图像,那不是很好吗?这可以帮助我们确定以下潜在问题。
2.检查后,如果我们认为需要删除某些数据点,则使用Lasso Selector来实现。
from matplotlib.widgets import LassoSelectorfrom matplotlib.path import Path as mplPath
class SelectFromCollection: def __init__(self, ax, collection, alpha_other=0.3): self.canvas = ax.figure.canvas self.collection = collection
self.xys = collection.get_offsets() self.lasso = LassoSelector(ax, onselect=self.onselect) self.ind = []
def onselect(self, verts): path = mplPath(verts) self.ind = np.nonzero(path.contains_points(self.xys))[0] self.canvas.draw_idle()
def disconnect(self): self.canvas.draw_idle()


