作者:王洪武
微信:王洪武
@
天津
二八轮动是
FOF
里非常简单的一个策略,下面来简单回测一下策略的有效性。
选择三个品种:
(1)
二取沪深
300
指数;
(2)
八取中证
500
指数;
(3)
无风险取现金
.
策略逻辑:
初始状态为空仓
过去
N
个交易日,两个指数收益哪个高就持有哪个指数
N
个交易日,如两个指数过去
N
个交易日收益均为负值,则投资组合持有现金,空仓现金利息为
0.0%
,暂不考虑手续费。
第一部分:
回测分析
载入数据
: 采用沪深300与中证500价格指数
clear; clc
load data.mat
N=10;
%
持仓每
N
个交易日轮动一次
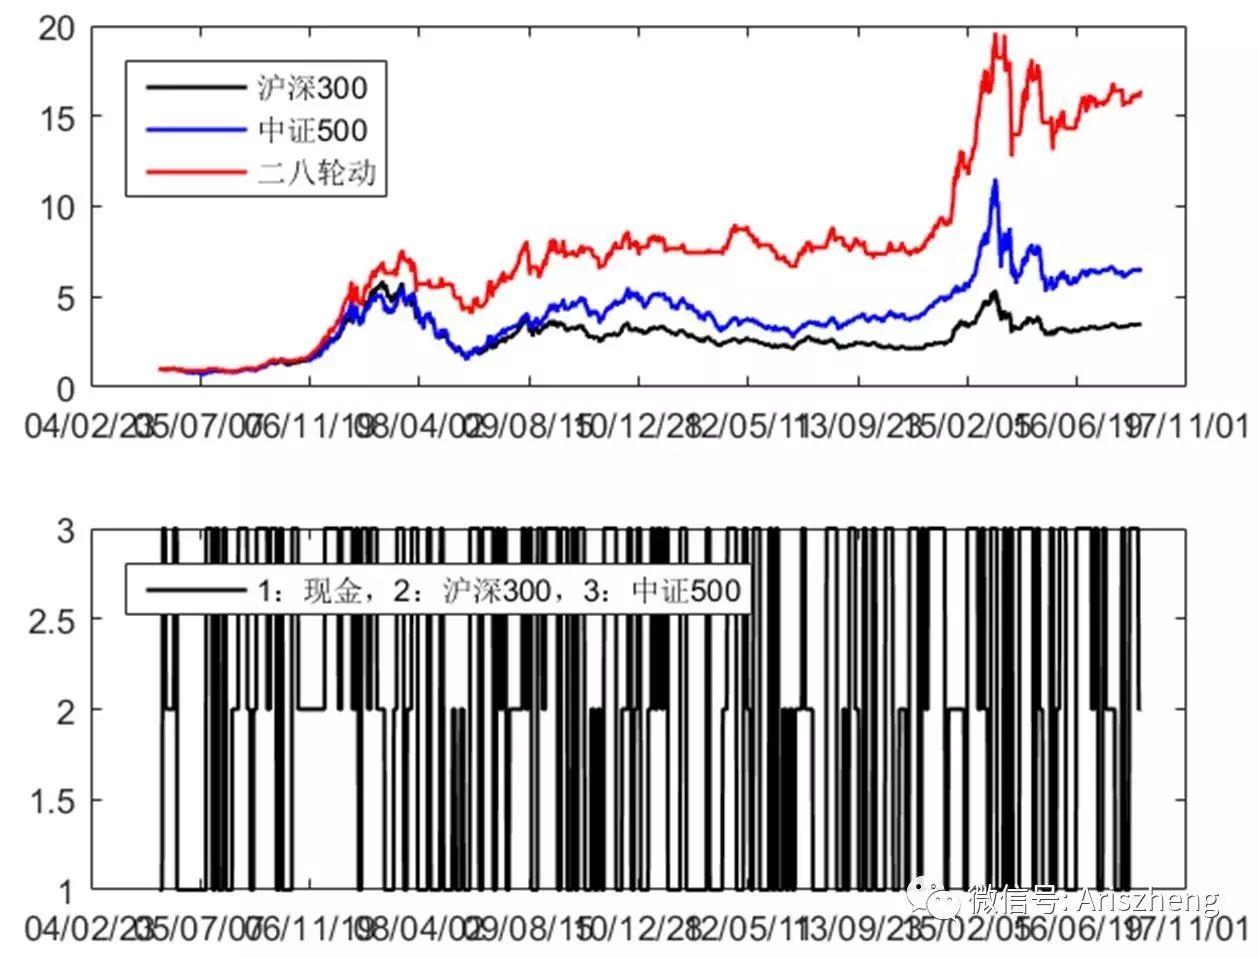
投资组合持仓数据:
1
:现金
2
:沪深
300 3
:中证
500
PortAsset=zeros(DataLength,1);
PortAsset(1:N,1)=1;
for
i=N:N:DataLength
Return=[0,IndexData(i,:)./IndexData(i-N+1,:)-1];
[Val,Idx]=max(Return);
if
i+N
PortAsset(i+1:i+N)=Idx;
%i日尾盘调仓
else
PortAsset(i+1:end)=Idx;
end
end
PortReturn=zeros(DataLength,1);
for
i=1:DataLength
switch
PortAsset(i)
case
1
PortReturn(i)=0;
case
2
PortReturn(i)=IndexData(i,1)/IndexData(i-1,1)-1;
otherwise
PortReturn(i)=IndexData(i,2)/IndexData(i-1,2)-1;
end
end
PortNav=zeros(DataLength,1);
PortNav(1)=1.00;
for
i=2:DataLength
PortNav(i)=PortNav(i-1)*(1+PortReturn(i));
end
figure;
subplot(2,1,1)
plot(Date,IndexData(:,1)/1000,
'k'
,
'LineWidth'
,1.2);
hold
on
;
plot(Date,IndexData(:,2)/1000,
'b'
,
'LineWidth'
,1.2);
plot(Date,PortNav,
'r'
,
'LineWidth'
,1.2);
dateaxis(
'x'
,17);
legend(
'沪深300'
,
'中证500'
,
'二八轮动'
,
'Location'
,
'NorthWest'
)
subplot(2,1,2)
plot(Date,PortAsset,
'k'
,
'LineWidth'
,1.2);
dateaxis(
'x'
,17);
legend(
'1:现金,2:沪深300,3:中证500'
,
'Location'
,
'NorthWest'
)
prices1=[IndexData PortNav];
%
价格数据
changes1=tick2ret(prices1);
%收益率数据
prices_std=ret2tick(changes1);
%标准化价格
names=[IndexName,{
'二八轮动'
}];
time_span=Date(end)-Date(1);
time_span_year=time_span/365
time_span_year =
12.2740
(
1
)
return
totalYield=prices_std(end,:)-1
totalYield =
2.5175 5.5787 15.4020
公式
(
1+yieldYear
)
^time_span_year-1=totalYield
yieldYear=(totalYield+1).^(1/time_span_year)-1
yieldYear =
0.1079 0.1659 0.2560
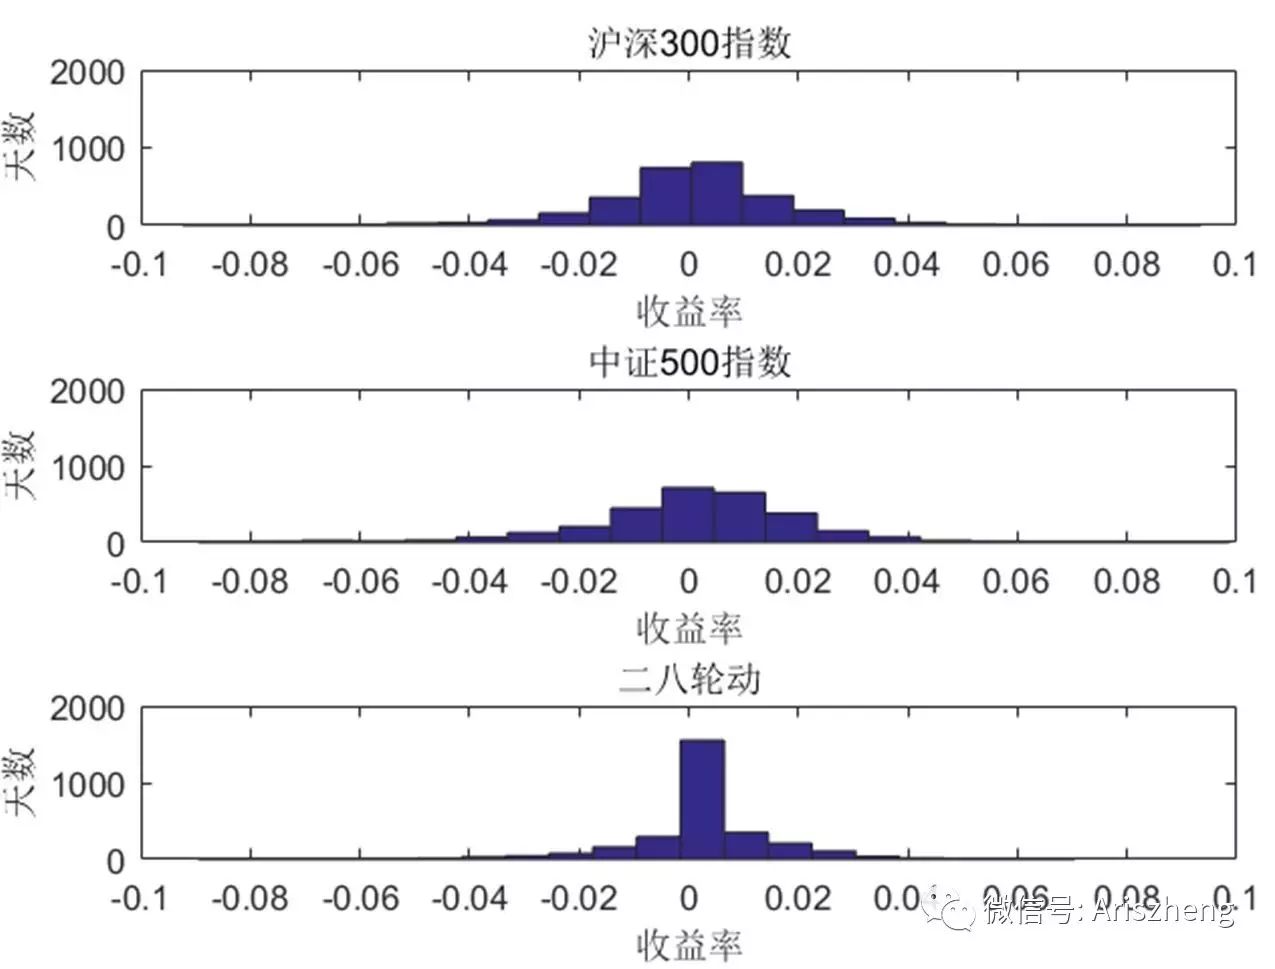
figure
subplot(3,1,1)
hist(changes1(:,1),20);
xlim([-0.1 0.1])
ylim([0 2000])
title(names{1})
xlabel(
'
收益率
'
);
ylabel(
'天数'
);
subplot(3,1,2)
hist(changes1(:,2),20);
xlim([-0.1 0.1])
ylim([0 2000])
title(names{2})
xlabel(
'收益率'
);
ylabel(
'天数'
);
subplot(3,1,3)
hist(changes1(:,3),20);
xlim([-0.1 0.1])
ylim([0 2000])
title(names{3})
xlabel(
'收益率'
);
ylabel(
'天数'
);
(
2
)
risk
volatility=std(changes1);
%
波动率
volatilityYear=volatility*sqrt(250)
%按照250个交易日计算
volatilityYear =
0.2881 0.3289 0.2404
C=cummax(prices_std);
maxDrawVector = (C-prices_std)./C;
%
最大回撤向量
maxDrawRate=max(maxDrawVector)
maxDrawRate =
0.7230 0.7242 0.4627
figure
% bar(Date,maxDrawVector)
area(Date,[maxDrawVector(:,1), maxDrawVector(:,2)-maxDrawVector(:,1),maxDrawVector(:,3)-maxDrawVector(:,2)]);
legend(fliplr(names),
'Location'
,
'northwest'
)
ylabel(
'最大回撤率'
)
datetick(
'x'
,
'yyyymmdd'
)
beta1=regress(changes1(:,3),changes1(:,1))
%
相对于沪深
300
beta2=regress(changes1(:,3),changes1(:,2))
%相对于中证500
beta1 =
0.5874
beta2 =
0.5199
(
3
)
return to risk
yieldYearDividemaxDraw=yieldYear./maxDrawRate
yieldYearDividemaxDraw =
0.1492 0.2291 0.5532
xx=sum(changes1(:,3)>0);
yy=sum(changes1(:,3)~=0);
winRate=xx/yy
winRate =
0.5963
Riskless=0;
Sharpe = (yieldYear-Riskless)./volatilityYear
Sharpe =
0.3745 0.5043 1.0646
(
4
)
return to benchmark
Returns=changes1(:,3);
Benchmark=changes1(:,1);
Cash=0;
alpha1=portalpha(Returns, Benchmark,Cash,
'capm'
)
Returns=changes1(:,3);
Benchmark=changes1(:,2);
Cash=0;
alpha2=portalpha(Returns, Benchmark,Cash,
'capm'
)
alpha1 =
7.1139e-04
alpha2 =
6.1517e-04
Jensen1=yieldYear(3)-beta1*yieldYear(1)
%
相对沪深
300
Jensen2=yieldYear(3)-beta2*yieldYear(2)
%相对中证500
Jensen1 =
0.1926
Jensen2 =
0.1697
Returns=changes1(:,3);
Benchmark=changes1(:,1);
InfoRatio1 = inforatio(Returns, Benchmark)
Returns=changes1(:,3);
Benchmark=changes1(:,2);
InfoRatio2 = inforatio(Returns, Benchmark)
InfoRatio1 =
0.0354
InfoRatio2 =
0.0140
第三部分:
参数优化
N=5:1:60;
h=@Wheeled28;
[return11, maxDraw11, sharp11]=arrayfun(h,N);
figure
bar(N,return11');
title(
'
持仓周期与回报率的关系
'
)
% 标记最佳标的
[maxReturn, maxN]=max(return11);
hold
on
bar(N(maxN),maxReturn,
'FaceColor'
, [1 .25 .25],
'EdgeColor'
,
'none'
);
text(N(maxN),maxReturn ,[
'Best:'
,num2str(N(maxN))],
'HorizontalAlignment'
,
'center'
,
'VerticalAlignment'
,
'Bottom'
);

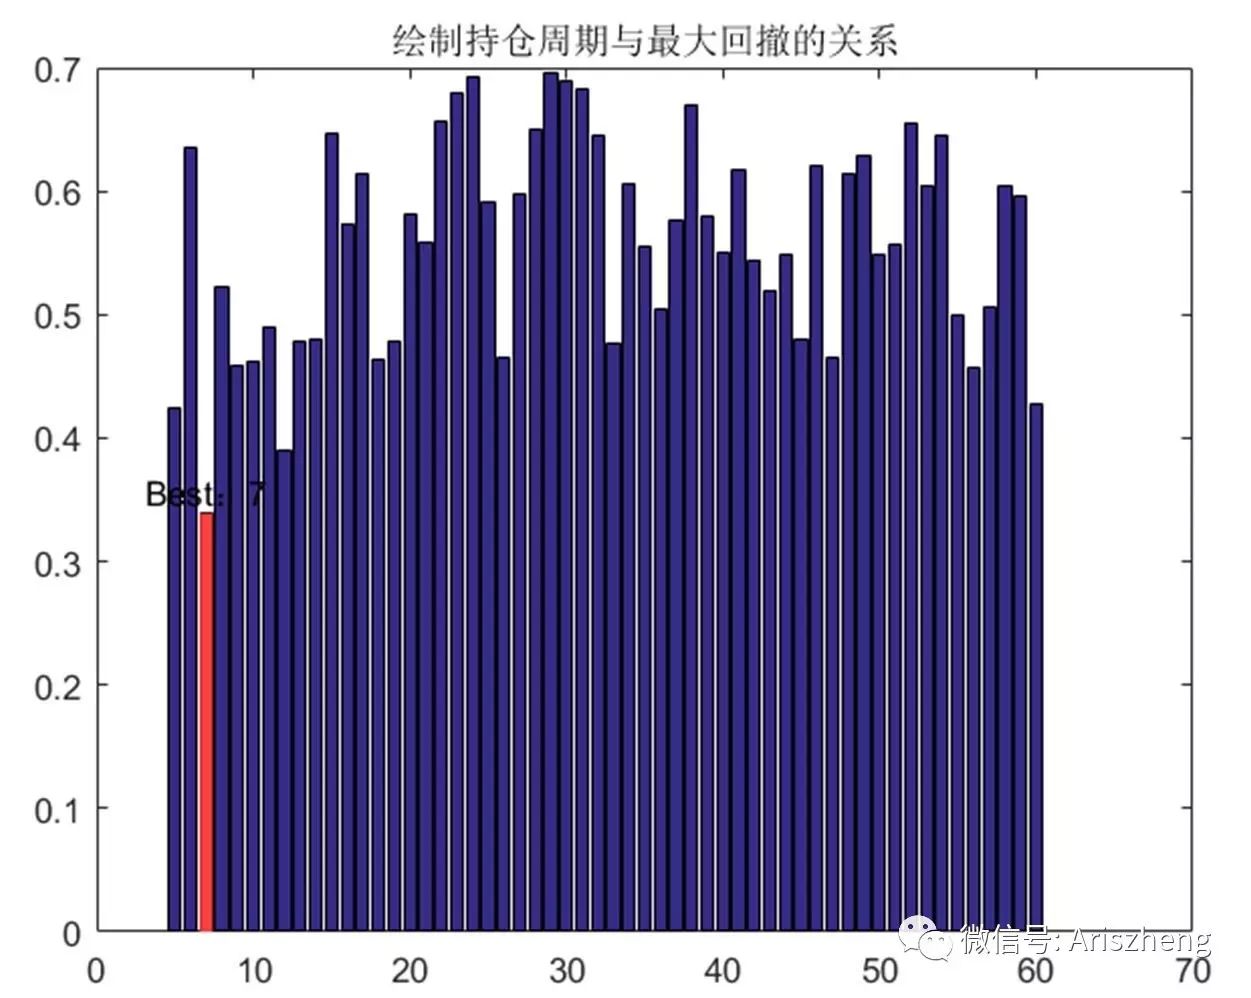
figure
bar(N,maxDraw11');
title(
'
绘制持仓周期与最大回撤的关系
'
)
% 标记最佳标的
[minDraw, minN]=min(maxDraw11);
hold
on
bar(N(minN),minDraw,
'FaceColor'
, [1 .25 .25],
'EdgeColor'
,
'none'
);
text(N(minN),minDraw ,[
'Best:'
,num2str(N(minN))],
'HorizontalAlignment'
,
'center'
,
'VerticalAlignment'
,
'Bottom'
);
figure
bar(N,return11'./maxDraw11');
title(
'
持仓周期与收益回撤比的关系
'
)
% 标记最佳标的
[maxSharp, maxN]=max(return11'./maxDraw11');
hold
on
bar(N(maxN),maxSharp,
'FaceColor'
, [1 .25 .25],
'EdgeColor'
,
'none'
);
text(N(maxN),maxSharp ,[
'Best:'
,num2str(N(maxN))],
'HorizontalAlignment'
,
'center'
,
'VerticalAlignment'
,
'Bottom'
);
figure
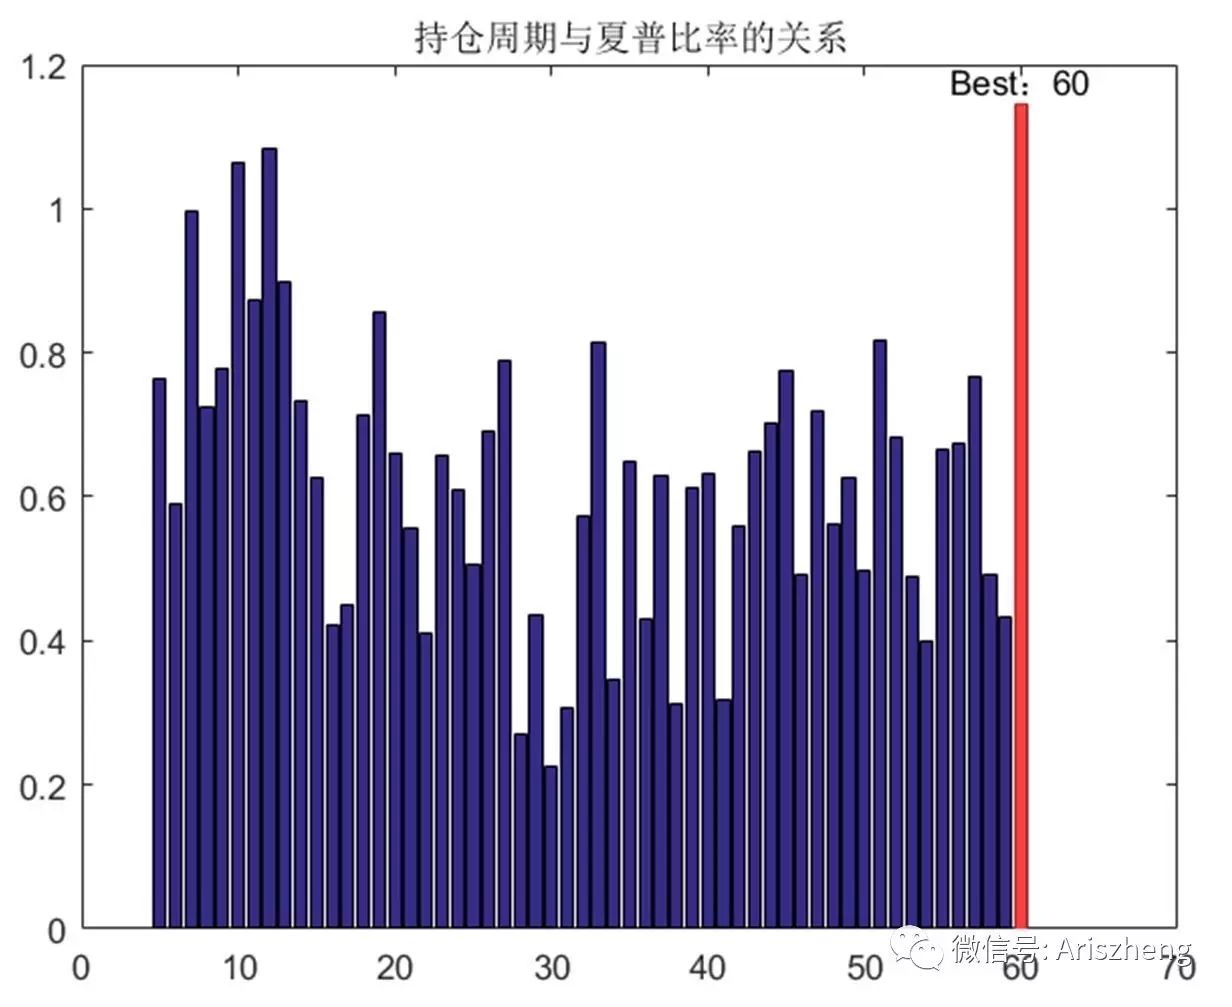
bar(N,sharp11');
title(
'
持仓周期与夏普比率的关系
'
)
% 标记最佳标的
[maxSharp, maxN]=max(sharp11);
hold
on
bar(N(maxN),maxSharp,
'FaceColor'
, [1 .25 .25],
'EdgeColor'
,
'none'
);
text(N(maxN),maxSharp ,[
'Best:'
,num2str(N(maxN))],
'HorizontalAlignment'
,
'center'
,
'VerticalAlignment'
,
'Bottom'
);
第四部分:
总结
(
1
)二八轮动策略逻辑是趋势追踪,靠轮动控制品种和仓位,和大多数趋势策略一样,长期能跑赢指数;
(
2
)缺点是回撤比较大,可以考虑加入动态止盈止损来控制回撤;
(
3
)从参数寻优的结果来看
7-12
稳定性较强,莫陷入参数过度优化的陷阱。
第五部分:
改进
(
1
)计算时增加手续费和滑点
(
2
)调仓周期改为自然周、自然月或者自然季度
(
3
)策略中增加动态止盈止损
勤劳的老郑,最近以码字维生
打赏与购书请点击原文链接!