(点击
上方公众号
,可快速关注)
来源:bea_tree
英文:kaggle
链接:blog.csdn.net/bea_tree/article/details/50757338
原文采用了kaggle上iris花的数据,数据来源从上面的网址上找噢
如果没有seaborn库 安装方法如下
http://www.ithao123.cn/content-10393533.html
正式开始了~~~
# 首先载入pandas
import pandas
as
pd
# 我们将载入seaborn,但是因为载入时会有警告出现,因此先载入warnings,忽略警告
import warnings
warnings
.
filterwarnings
(
"ignore"
)
import seaborn
as
sns
import
matplotlib
.
pyplot
as
plt
sns
.
set
(
style
=
"white"
,
color_codes
=
True
)
# 载入数据
iris
=
pd
.
read_csv
(
"../input/Iris.csv"
)
# 数据现在为 DataFrame格式
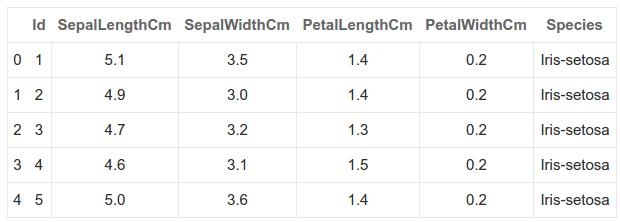
# 用head函数看一下数据结构啥样
iris
.
head
()
数据结构就这样:

# 让我们用counts功能看下一共有多少种花
iris
[
"Species"
].
value_counts
()
结果是:
Iris
-
setosa
50
Iris
-
virginica
50
Iris
-
versicolor
50
Name
:
Species
,
dtype
:
int64
1.
# 使用 .plot 做散点图
iris
.
plot
(
kind
=
"scatter"
,
x
=
"SepalLengthCm"
,
y
=
"SepalWidthCm"
)
#数据为萼片的长和宽 结果如下

2.
# 开始使用seaborn了它能同时显示直方图噢
sns
.
jointplot
(
x
=
"SepalLengthCm"
,
y
=
"SepalWidthCm"
,
data
=
iris
,
size
=
5
)

3 神奇的还在下面:
# 我们还可以用seaborn's FacetGrid 标记不同的种类噢
sns
.
FacetGrid
(
iris
,
hue
=
"Species"
,
size
=
5
)
#hue英文是色彩的意思
.
map
(
plt
.
scatter
,
"SepalLengthCm"
,
"SepalWidthCm"
)
#注意这里的plt哦
.
add_legend
()

4 箱线图!
# Seaborn中的boxplot,可以画箱线图,可以看出不同种类的分布情况
sns
.
boxplot
(
x
=
"Species"
,
y
=
"PetalLengthCm"
,
data
=
iris
)

5、
# 利用striplot可以锦上添花,加上散点图
#
# 使振动值jitter=True 使各个散点分开,要不然会是一条直线
#
# 注意这里将坐标图用ax来保存了哦,这样第二次才会在原来的基础上加点
ax
=
sns
.
boxplot
(
x
=
"Species"
,
y
=
"PetalLengthCm"
,
data
=
iris
)
ax
=
sns
.
stripplot
(
x
=
"Species"
,
y
=
"PetalLengthCm"
,
data
=
iris
,
jitter
=
True
,
edgecolor
=
"gray"
)

6、小提琴图
# 这图可以变现出密度的分布
sns
.
violinplot
(
x
=
"Species"
,
y
=
"PetalLengthCm"
,
data
=
iris
,
size
=
6
)

7、kdeplot
# 通过这个曲线图可以看出不同特征值时的分布密度
sns
.
FacetGrid
(
iris
,
hue
=
"Species"
,
size
=
6
)
.
map
(
sns
.
kdeplot
,
"PetalLengthCm"
)
.
add_legend
()

8.大招来了
# pairplot显示不同特征之间的关系
sns
.
pairplot
(
iris
.
drop
(
"Id"
,
axis
=
1
),
hue
=
"Species"
,
size
=
3
)

9、中间对角线的图形也可以用kde显示哦
# 修改参数dige_kind
sns
.
pairplot
(
iris
.
drop
(
"Id"
,
axis
=
1
),
hue
=
"Species"
,
size
=
3
,
diag_kind
=
"kde"
)

10.现在是pandas表现的时间了
# 用Pandas 快速做出每个特征在不同种类下的箱线图
iris
.
drop
(
"Id"
,
axis
=
1
).
boxplot
(
by
=
"Species"
,
figsize
=
(
12
,
6
))

11.调和曲线图 Andrew Curves
首先啥是Andrew curves呢 看维基百科
https://en.wikipedia.org/wiki/Andrews_plot
他是将高维的点 化为二维的曲线,曲线是一条傅里叶函数的样子,参数项为不同的特征值,臆想出来了自变量t,这样每个点都是一条曲线
# 画图的函数在下面,我们会发现相同种类的线总是缠绵在一起,可以和聚类混在一起噢,事实上他们与欧氏距离是有关系的
from
pandas
.
tools
.
plotting import andrews_curves
andrews_curves
(
iris
.
drop
(
"Id"
,
axis
=
1
),
"Species"
)

12 轮廓图
https://en.wikipedia.org/wiki/Parallel_coordinates
# 轮廓图也是看高维数据的一种方法,将不同的特征放在横坐标,然后将各点的特征值放在纵坐标就可以了
from
pandas
.
tools
.
plotting import parallel_coordinates
parallel_coordinates
(
iris
.
drop
(
"Id"
,
axis
=
1
),
"Species"
)

13 radviz
http://www.doc88.com/p-912968623585.html
# 这也是一种将高维点表现在二维平面的方法,具体作图方法应该在上面的网址上应该有
from
pandas
.
tools
.
plotting import radviz
radviz
(
iris
.
drop
(
"Id"
,
axis
=
1
),
"Species"
)

暂时就是这些,希望会对大家有帮助
觉得本文对你有帮助?请分享给更多人
关注「Python开发者」
看更多技术干货


