
输入1:
install.packages("ggraph")
library(ggraph)
install.packages("igraph")
library(igraph)
myedges "edges.xlsx");myedges
myedges1 -3]
myvalue 10,myedges [3]);myvalue
myvertices as.character(myedges1$from), as.character(myedges1$to))) ,myvalue )
myvertices$group = myedges1$from[match( myvertices$name, myedges1$to)]
head(myvertices,20)
结果1:
name     value group
1    total 10.000000  <NA>
2        I  2.390000 total
3        T  1.370000 total
4        Y  1.370000 total
5        S  1.550000 total
6        M  1.610000 total
7        k  0.700000 total
8        W  1.010000 total
9   sub-I1  1.201771     I
10  sub-I2  1.188146     I
11  sub-I3  1.158170     I
12  sub-I4  1.209947     I
13  sub-I5  1.194959     I
14  sub-I6  1.129556     I
15  sub-I7  1.189508     I
16  sub-I8  1.115931     I
17  sub-I9  1.119240     I
18 sub-I10  1.031452     I
19 sub-I11  1.024639     I
20 sub-I12  1.004201     I
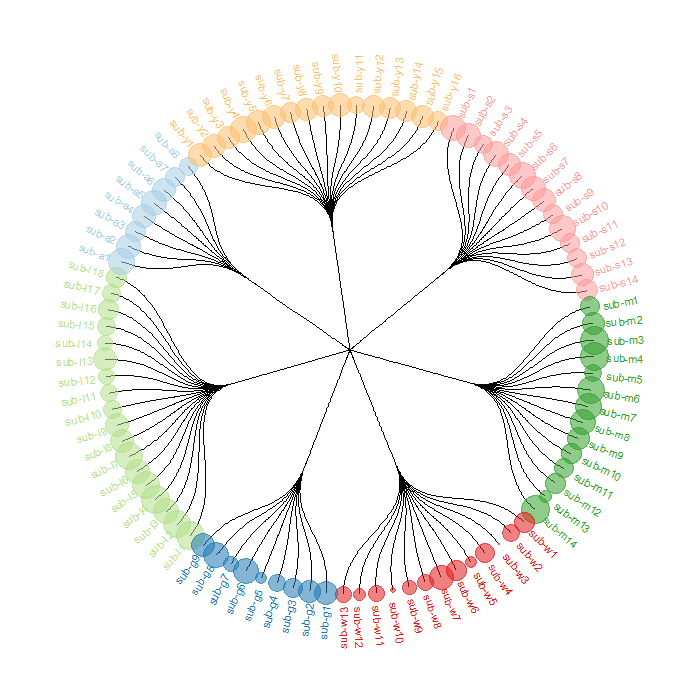
输入2:
mygraph <-
graph_from_data_frame(myedges1, vertices=myvertices,directed = T)
ggraph(mygraph, layout = 'dendrogram', circular = TRUE) +
geom_edge_diagonal(colour="black") +
scale_edge_colour_distiller(palette = "RdPu") +
geom_node_text(aes(x = x*1.05, y=y*1.05, filter = leaf, label=name,
hjust='outward', angle = -((-node_angle(x, y)+90)%%180)+90, size=3,
colour=group), size=3, alpha=1) +
geom_node_point(aes( x = x, y=y, filter = leaf,colour=group, size=value, alpha=0.2)) +
scale_colour_manual(values= rep( brewer.pal(9,"Paired") , 30)) +
scale_size_continuous( range = c(0.1,10) ) +
theme_void() +
theme(legend.position="none",plot.margin=unit(c(0,0,0,0),"cm")) +
expand_limits(x = c(-1.3, 1.3), y = c(-1.3, 1.3))
结果2:
输入3:
 ggraph(mygraph, layout = 'dendrogram') +
   geom_edge_diagonal2(aes(colour =node.group)) +
   geom_node_text(aes( filter=leaf,label=name, size=3,colour=group) ,angle=90, hjust=1, nudge_y=-0.1


