
数据挖掘入门与实战 公众号: datadw
第1步:确保MySQL已安装且在运行
安装教程:
亲测:MySQL安装与python下的MySQLdb使用(附软件与模块包)
第2步:使用Python连接MySQL
连接教程:
mysqldb库安装与python交互操作
第3步:Python中执行MySQL查询
cursor对象使用MySQL查询字符串执行查询,返回一个包含多个元组的元组——每行对应一个元组。如果你刚接触MySQL语法和命令,在线的
MySQL参考手册
https://dev.mysql.com/doc/refman/5.7/en/select.html
是一个很不错的学习资源。
本教程使用MySQL经典的“world”样例数据库。如果你想跟随我们的步骤,可以在
MySQL文档中心
https://dev.mysql.com/doc/world-setup/en/下载world数据库。
|
1
2
|
>>> cursor.execute(
'select Name, Continent, Population, LifeExpectancy, GNP from Country'
);
>>> rows
=
cursor.fetchall()
|
rows,也就是查询的结果,是一个包含多个元组的元组,像下面这样:
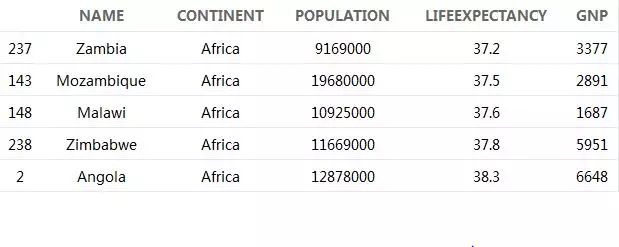
使用Pandas的DataFrame来处理每一行要比使用一个包含元组的元组方便。下面的Python代码片段将所有行转化为DataFrame实例:
?
|
1
2
3
4
|
>>>
import
pandas as pd
>>> df
=
pd.DataFrame( [[ij
for
ij
in
i]
for
i
in
rows] )
>>> df.rename(columns
=
{
0
:
'Name'
,
1
:
'Continent'
,
2
:
'Population'
,
3
:
'LifeExpectancy'
,
4
:
'GNP'
}, inplace
=
True
);
>>> df
=
df.sort([
'LifeExpectancy'
], ascending
=
[
1
]);
|
完整的代码可以参见
IPython notebook
http://nbviewer.jupyter.org/gist/jackparmer/5485807511a58be48bf2
第4步:使用Plotly绘制MySQL数据
现在,MySQL的数据存放在Pandas的DataFrame中,可以轻松地绘图。下面的代码用来绘制国家GNP(国民生产总值)VS平均寿命的图,鼠标悬停的点会显示国家名称。确保你已经下载了python的Plotly库。如果没有,你可以参考一下它的
入门指南
。https://plot.ly/python/bubble-charts-tutorial/
|
1
2
3
4
5
6
7
8
9
10
11
12
13
14
15
16
|
import
plotly.plotly as py
from
plotly.graph_objs
import
*
trace1
=
Scatter(
x
=
df[
'LifeExpectancy'
],
y
=
df[
'GNP'
],
text
=
country_names,
|


