
作者:Json、
一、ELK搭建篇
官网地址:
https://www.elastic.co/cn/
官网权威指南:
https://www.elastic.co/guide/cn/elasticsearch/guide/current/index.html
安装指南:
https://www.elastic.co/guide/en/elasticsearch/reference/5.x/rpm.html
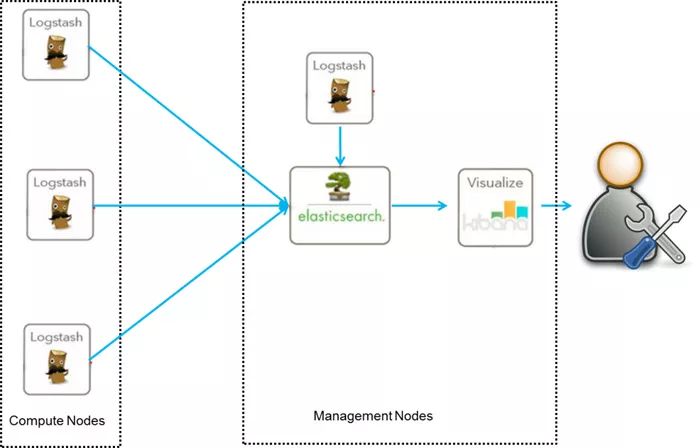
ELK是Elasticsearch、Logstash、Kibana的简称,这三者是核心套件,但并非全部。
Elasticsearch是实时全文搜索和分析引擎,提供搜集、分析、存储数据三大功能;是一套开放REST和JAVA API等结构提供高效搜索功能,可扩展的分布式系统。它构建于Apache Lucene搜索引擎库之上。
Logstash是一个用来搜集、分析、过滤日志的工具。它支持几乎任何类型的日志,包括系统日志、错误日志和自定义应用程序日志。它可以从许多来源接收日志,这些来源包括 syslog、消息传递(例如 RabbitMQ)和JMX,它能够以多种方式输出数据,包括电子邮件、websockets和Elasticsearch。
Kibana是一个基于Web的图形界面,用于搜索、分析和可视化存储在 Elasticsearch指标中的日志数据。它利用Elasticsearch的REST接口来检索数据,不仅允许用户创建他们自己的数据的定制仪表板视图,还允许他们以特殊的方式查询和过滤数据
环境
Centos6.5 两台
IP:192.168.1.202 安装: elasticsearch、logstash、Kibana、Nginx、Http、Redis
    192.168.1.201 安装:  logstash
安装
安装elasticsearch的yum源的密钥(这个需要在所有服务器上都配置)
# rpm --import https://artifacts.elastic.co/GPG-KEY-elasticsearch

配置elasticsearch的yum源
# vim /etc/yum.repos.d/elasticsearch.repo

在elasticsearch.repo文件中添加如下内容
[elasticsearch-5.x]
name=Elasticsearch repository for 5.x packages
baseurl=https://artifacts.elastic.co/packages/5.x/yum
gpgcheck=1
gpgkey=https://artifacts.elastic.co/GPG-KEY-elasticsearch
enabled=1
autorefresh=1
type=rpm-md
安装elasticsearch的环境
安装elasticsearch
# yum install -y elasticsearch

安装java环境(java环境必须是1.8版本以上的)

wget http://download.oracle.com/otn-pub/java/jdk/8u131-b11/d54c1d3a095b4ff2b6607d096fa80163/jdk-8u131-linux-x64.rpm

rpm -ivh jdk-8u131-linux-x64.rpm

验证java安装成功
java -version
java version "1.8.0_131"
Java(TM) SE Runtime Environment (build 1.8.0_131-b11)
Java HotSpot(TM) 64-Bit Server VM (build 25.131-b11, mixed mode)
创建elasticsearch data的存放目录,并修改该目录的属主属组
#
mkdir -p /data/es-data (自定义用于存放data数据的目录)
# chown -R elasticsearch:elasticsearch /data/es-data
修改elasticsearch的日志属主属组
# chown -R elasticsearch:elasticsearch /var/log/elasticsearch/
修改elasticsearch的配置文件
# vim /etc/elasticsearch/elasticsearch.yml

找到配置文件中的cluster.name,打开该配置并设置集群名称
cluster.name: demon

找到配置文件中的node.name,打开该配置并设置节点名称
node.name: elk-1

修改data存放的路径
path.data: /data/es-data

修改logs日志的路径
path.logs: /var/log/elasticsearch/

配置内存使用用交换分区
bootstrap.memory_lock: true

监听的网络地址
network.host: 0.0.0.0

开启监听的端口
http.port: 9200

增加新的参数,这样head插件可以访问es (5.x版本,如果没有可以自己手动加)
http.cors.enabled: true
http.cors.allow-origin: "*"
启动elasticsearch服务
启动服务
/etc/init.d/elasticsearch start

Starting elasticsearch: Java HotSpot(TM) 64-Bit Server VM warning: INFO: os::commit_memory(0x0000000085330000, 2060255232, 0) failed; error='Cannot allocate memory' (errno=12)
#
# There is insufficient memory for the Java Runtime Environment to continue.
# Native memory allocation (mmap) failed to map 2060255232 bytes for committing reserved memory.
# An error report file with more information is saved as:
# /tmp/hs_err_pid2616.log
                                                           [FAILED]
这个报错是因为默认使用的内存大小为2G,虚拟机没有那么多的空间

修改参数:
vim /etc/elasticsearch/jvm.options
-Xms512m
-Xmx512m

再次启动
/etc/init.d/elasticsearch start

查看服务状态,如果有报错可以去看错误日志 less /var/log/elasticsearch/demon.log(日志的名称是以集群名称命名的)

创建开机自启动服务
# chkconfig elasticsearch on
注意事项
需要修改几个参数,不然启动会报错

vim /etc/security/limits.conf
在末尾追加以下内容(elk为启动用户,当然也可以指定为*)
elk soft nofile 65536
elk hard nofile 65536
elk soft nproc 2048
elk hard nproc 2048
elk soft memlock unlimited
elk hard memlock unlimited

继续再修改一个参数
vim /etc/security/limits.d/90-nproc.conf
将里面的1024改为2048(ES最少要求为2048)
*          soft    nproc     2048

另外还需注意一个问题(在日志发现如下内容,这样也会导致启动失败,这一问题困扰了很久)
[2017-06-14T19:19:01,641][INFO ][o.e.b.BootstrapChecks    ] [elk-1] bound or publishing to a non-loopback or non-link-local address, enforcing bootstrap checks
[2017-06-14T19:19:01,658][ERROR][o.e.b.Bootstrap          ] [elk-1] node validation exception
[1] bootstrap checks failed
[1]: system call filters failed to install; check the logs and fix your configuration or disable system call filters at your own risk

解决:修改配置文件,在配置文件添加一项参数(目前还没明白此参数的作用)
vim /etc/elasticsearch/elasticsearch.yml
bootstrap.system_call_filter: false
通过浏览器请求下9200的端口,看下是否成功
先检查9200端口是否起来
netstat -antp |grep 9200
tcp 0 0 :::9200 :::* LISTEN 2934/java
浏览器访问测试是否正常(以下为正常)
# curl http:
{
"name" : "linux-node1",
"cluster_name" : "demon",
"cluster_uuid" : "kM0GMFrsQ8K_cl5Fn7BF-g",
"version"
: {
"number" : "5.4.0",
"build_hash" : "780f8c4",
"build_date" : "2017-04-28T17:43:27.229Z",
"build_snapshot" : false,
"lucene_version" : "6.5.0"
},
"tagline" : "You Know, for Search"
}
如何和elasticsearch交互
JavaAPI

RESTful API
Javascript,.Net,PHP,Perl,Python

利用API查看状态
# curl -i -XGET 'localhost:9200/_count?pretty'
    HTTP/1.1 200 OK
    content-type: application/json; charset=UTF-8
    content-length: 95

    {
      "count" : 0,
      "_shards" : {
        "total" : 0,
        "successful" : 0,
        "failed" : 0
      }
    }
安装插件
安装elasticsearch-head插件
安装docker镜像或者通过github下载elasticsearch-head项目都是可以的,1或者2两种方式选择一种安装使用即可
1. 使用docker的集成好的elasticsearch-head
# docker run -p 9100:9100 mobz/elasticsearch-head:5
docker容器下载成功并启动以后,运行浏览器打开http:
2. 使用git安装elasticsearch-head
# yum install -y npm
# git clone git:
# cd elasticsearch-head
# npm install
# npm run start
检查端口是否起来
netstat -antp |grep 9100
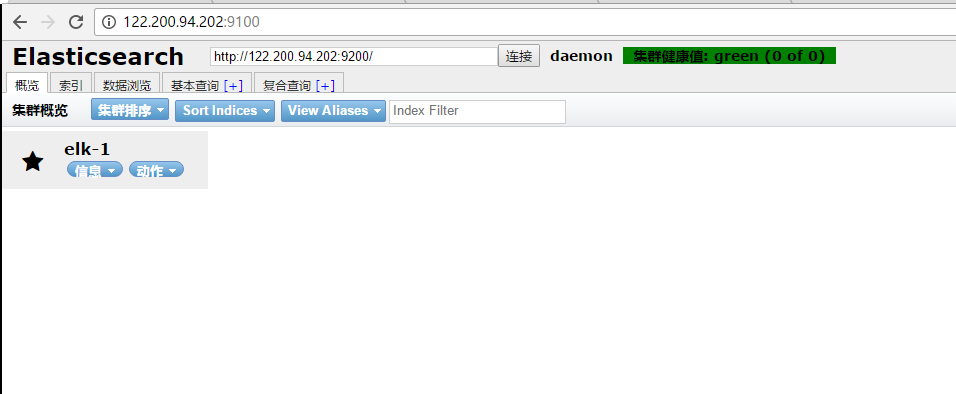
浏览器访问测试是否正常
http:
LogStash的使用
安装Logstash环境:
官方安装手册:
https://www.elastic.co/guide/en/logstash/current/installing-logstash.html
下载yum源的密钥认证:
# rpm --import https://artifacts.elastic.co/GPG-KEY-elasticsearch
利用yum安装logstash
# yum install -y logstash
查看下logstash的安装目录
# rpm -ql logstash
创建一个软连接,每次执行命令的时候不用在写安装路劲(默认安装在/usr/share下)
ln -s /usr/share/logstash/bin/logstash /bin/
执行logstash的命令
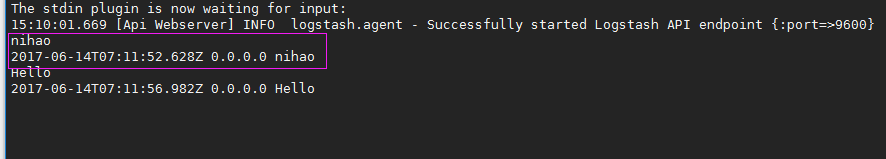
# logstash -e 'input { stdin { } } output { stdout {} }'
运行成功以后输入:
nihao
stdout返回的结果:
注:
-e 执行操作
input 标准输入
{ input } 插件
output 标准输出
{ stdout } 插件
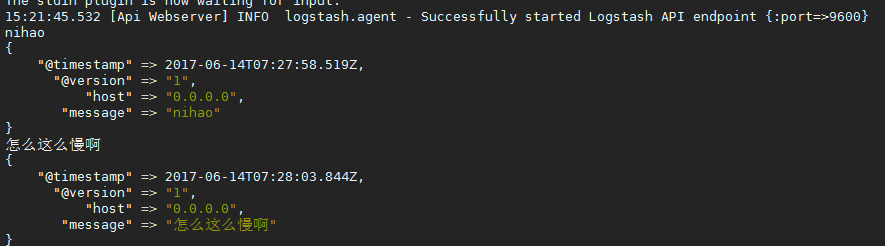
通过rubydebug来输出下更详细的信息
# logstash -e 'input { stdin { } } output { stdout {codec => rubydebug} }'
执行成功输入:
nihao
stdout输出的结果:
如果标准输出还有elasticsearch中都需要保留应该怎么玩,看下面
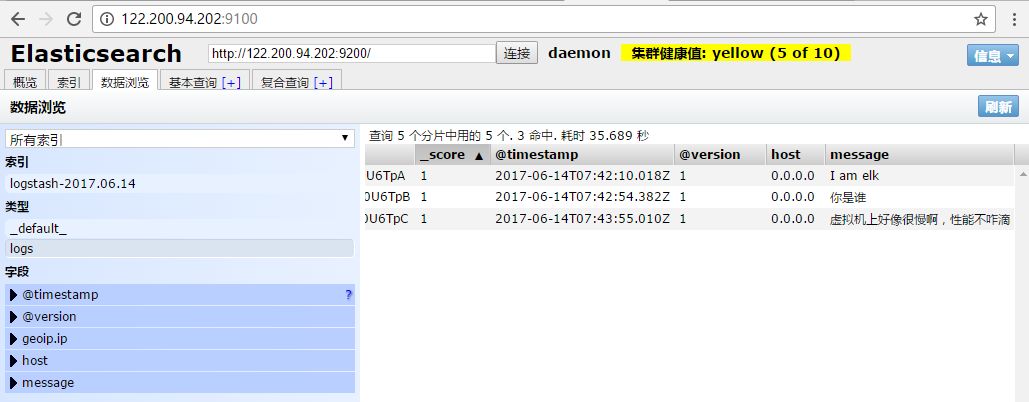
# /usr/share/logstash/bin/logstash -e 'input { stdin { } } output { elasticsearch { hosts => ["192.168.1.202:9200"] } stdout { codec => rubydebug }}'
运行成功以后输入:
I am elk
返回的结果(标准输出中的结果):
logstash使用配置文件
官方指南:
https://www.elastic.co/guide/en/logstash/current/configuration.html
创建配置文件01-logstash.conf
# vim /etc/logstash/conf.d/elk.conf
文件中添加以下内容
input { stdin { } }
output {
elasticsearch { hosts => ["192.168.1.202:9200"] }
stdout { codec => rubydebug }
}
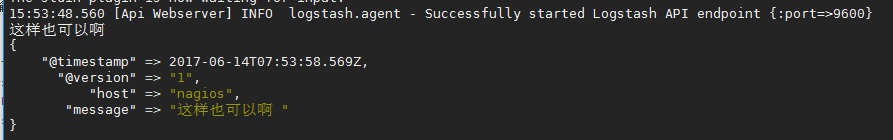
使用配置文件运行logstash
# logstash -f ./elk.conf
运行成功以后输入以及标准输出结果
logstash的数据库类型
1. Input插件
权威指南:https://www.elastic.co/guide/en/logstash/current/input-plugins.html
file插件的使用
# vim /etc/logstash/conf.d/elk.conf
添加如下配置
input {
file {
path => "/var/log/messages"
type => "system"
start_position => "beginning"
}
}
output {
elasticsearch {
hosts => ["192.168.1.202:9200"]
index => "system-%{+YYYY.MM.dd}"
}
}
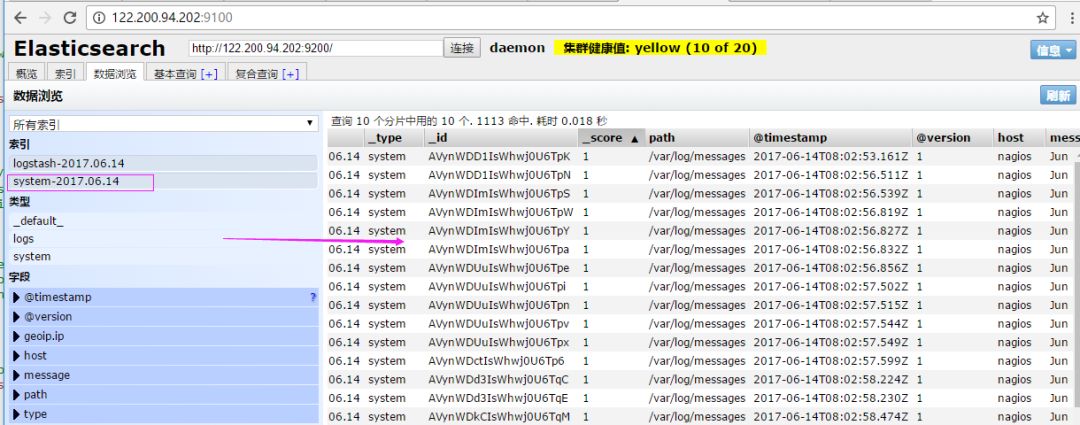
运行logstash指定elk.conf配置文件,进行过滤匹配
#logstash -f /etc/logstash/conf.d/elk.conf
来一发配置安全日志的并且把日志的索引按类型做存放,继续编辑elk.conf文件
# vim /etc/logstash/conf.d/elk.conf
添加secure日志的路径
input {
file {
path => "/var/log/messages"
type => "system"
start_position => "beginning"
}
file {
path => "/var/log/secure"
type => "secure"
start_position => "beginning"
}
}
output {
if [type] == "system" {
elasticsearch {
hosts => ["192.168.1.202:9200"]
index => "nagios-system-%{+YYYY.MM.dd}"
}
}
if [type] == "secure" {
elasticsearch {
hosts => ["192.168.1.202:9200"]
index => "nagios-secure-%{+YYYY.MM.dd}"
}
}
}
运行logstash指定elk.conf配置文件,进行过滤匹配
# logstash -f ./elk.conf
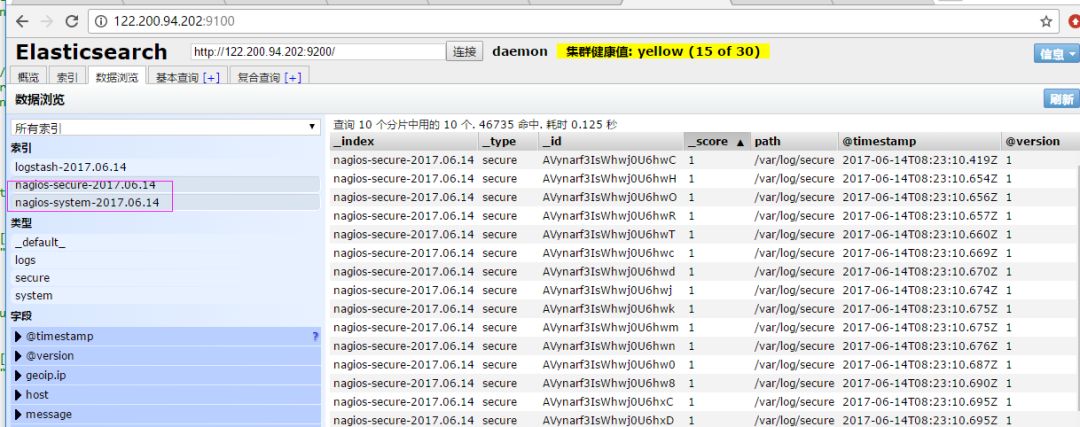
这些设置都没有问题之后,接下来安装下kibana,可以让在前台展示
Kibana的安装及使用
安装kibana环境
官方安装手册:https://www.elastic.co/guide/en/kibana/current/install.html
下载kibana的tar.gz的软件包
# wget https://artifacts.elastic.co/downloads/kibana/kibana-5.4.0-linux-x86_64.tar.gz
解压kibana的tar包
# tar -xzf kibana-5.4.0-linux-x86_64.tar.gz
进入解压好的kibana
# mv kibana-5.4.0-linux-x86_64 /usr/local
创建kibana的软连接
# ln -s /usr/local/kibana-5.4.0-linux-x86_64/ /usr/local/kibana
编辑kibana的配置文件
# vim /usr/local/kibana/config/kibana.yml
修改配置文件如下,开启以下的配置
server.port: 5601
server.host: "0.0.0.0"
elasticsearch.url: "http://192.168.1.202:9200"
kibana.index: ".kibana"
安装screen,以便于kibana在后台运行(当然也可以不用安装,用其他方式进行后台启动)
# yum -y install screen
# screen
# /usr/local/kibana/bin/kibana
netstat -antp |grep 5601
tcp 0 0 0.0.0.0:5601 0.0.0.0:* LISTEN 17007/node
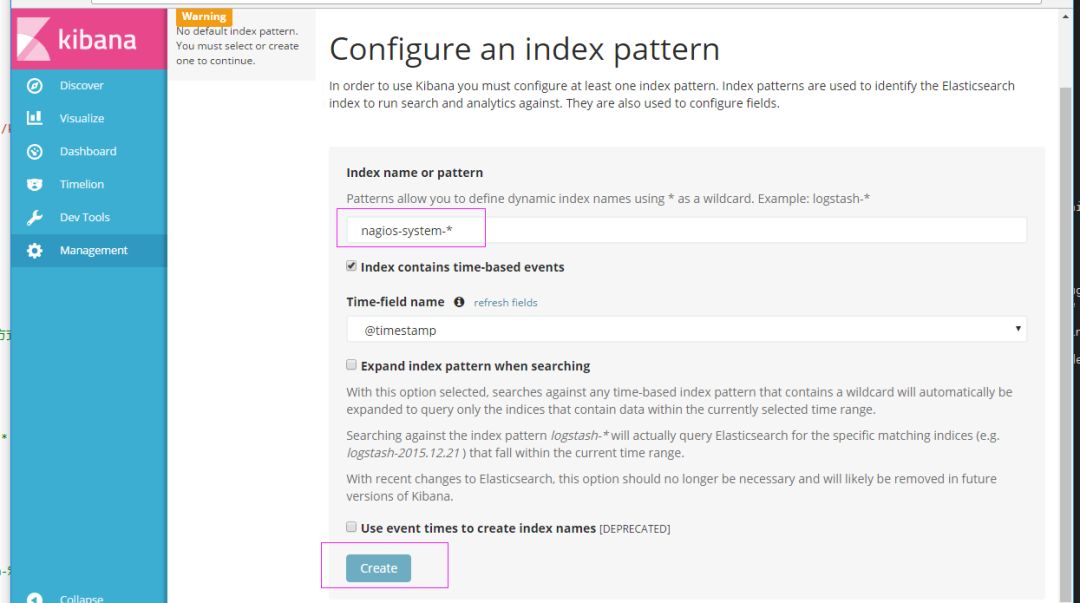
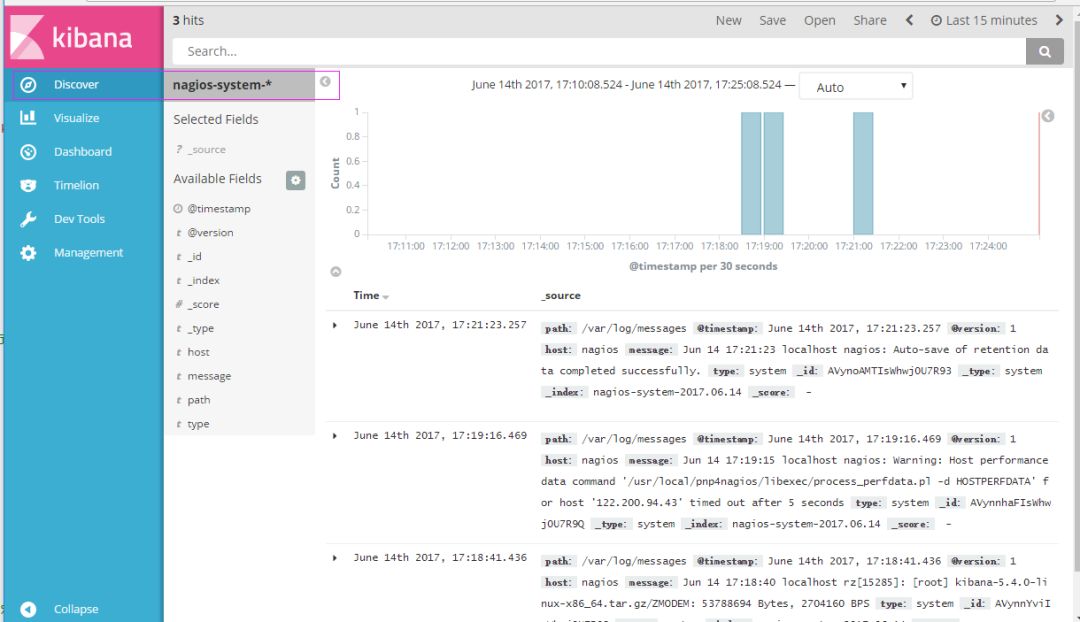
打开浏览器并设置对应的index
http://IP:5601
二、ELK实战篇
好,现在索引也可以创建了,现在可以来输出nginx、apache、message、secrue的日志到前台展示(Nginx有的话直接修改,没有自行安装)
编辑nginx配置文件,修改以下内容(在http模块下添加)
log_format json '{"@timestamp":"$time_iso8601",'
'"@version":"1",'
'"client":"$remote_addr",'
'"url":"$uri",'
'"status":"$status",'
'"domian":"$host",'
'"host":"$server_addr",'
'"size":"$body_bytes_sent",'
'"responsetime":"$request_time",'
'"referer":"$http_referer",'
'"ua":"$http_user_agent"'
'}';
修改access_log的输出格式为刚才定义的json
access_log logs/elk.access.log json;
继续修改apache的配置文件
LogFormat "{ \
\"@timestamp\": \"%{%Y-%m-%dT%H:%M:%S%z}t\", \
\"@version\": \"1\", \
\"tags\":[\"apache\"], \
\"message\": \"%h %l %u %t \\\"%r\\\" %>s %b\", \
\"clientip\": \"%a\", \
\"duration\": %D, \
\"status\": %>s, \
\"request\": \"%U%q\", \
\"urlpath\": \"%U\", \
\"urlquery\": \"%q\", \
\"bytes\": %B, \
\"method\": \"%m\", \
\"site\": \"%{Host}i\", \
\"referer\": \"%{Referer}i\", \
\"useragent\": \"%{User-agent}i\" \
}" ls_apache_json
一样修改输出格式为上面定义的json格式
CustomLog logs/access_log ls_apache_json
编辑logstash配置文件,进行日志收集
vim /etc/logstash/conf.d/full.conf
input {
file {
path => "/var/log/messages"
type => "system"
start_position => "beginning"
}
file {
path => "/var/log/secure"
type => "secure"
start_position => "beginning"
}
file {
path => "/var/log/httpd/access_log"
type => "http"
start_position => "beginning"
}
file {
path => "/usr/local/nginx/logs/elk.access.log"
type => "nginx"
start_position => "beginning"
}
}
output {
if [type
] == "system" {
elasticsearch {
hosts => ["192.168.1.202:9200"]
index => "nagios-system-%{+YYYY.MM.dd}"
}
}
if [type] == "secure" {
elasticsearch {
hosts => ["192.168.1.202:9200"]
index => "nagios-secure-%{+YYYY.MM.dd}"
}
}
if [type] == "http" {
elasticsearch {
hosts => ["192.168.1.202:9200"]
index => "nagios-http-%{+YYYY.MM.dd}"
}
}
if [type] == "nginx" {
elasticsearch {
hosts => ["192.168.1.202:9200"]
index => "nagios-nginx-%{+YYYY.MM.dd}"
}
}
}
运行看看效果如何
logstash -f /etc/logstash/conf.d/full.conf
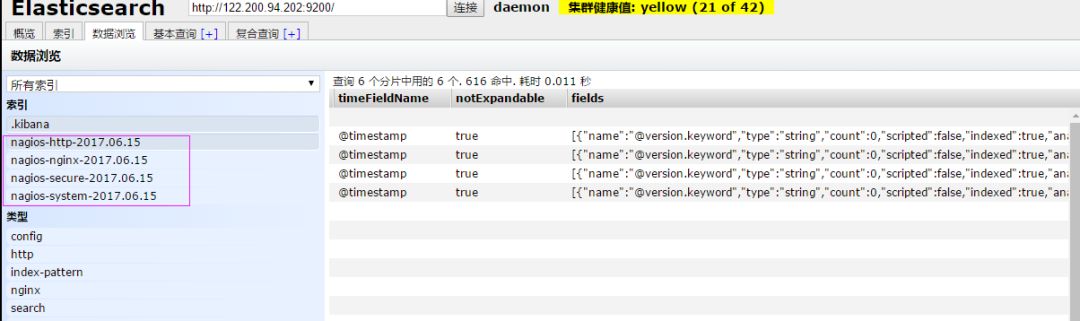
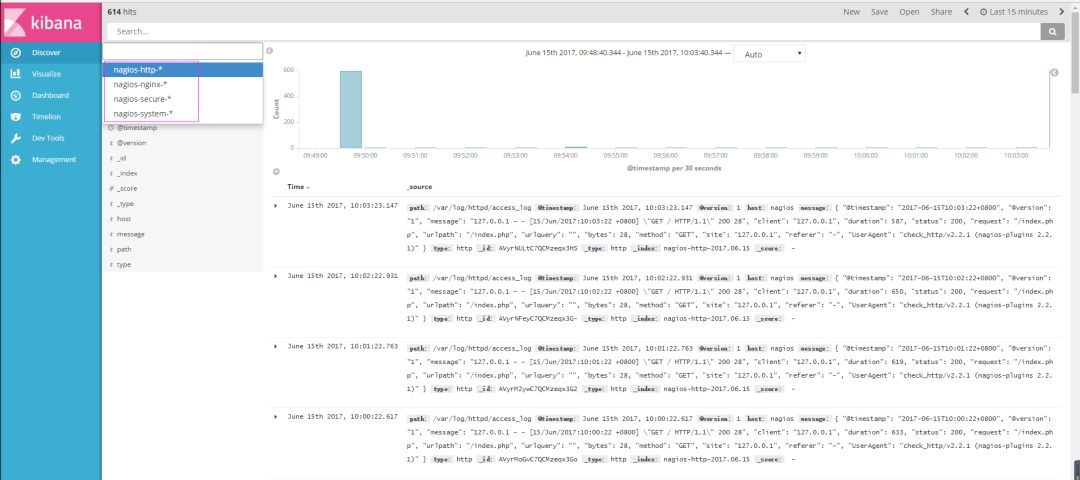
可以发现所有创建日志的索引都已存在,接下来就去Kibana创建日志索引,进行展示(按照上面的方法进行创建索引即可),看下展示的效果
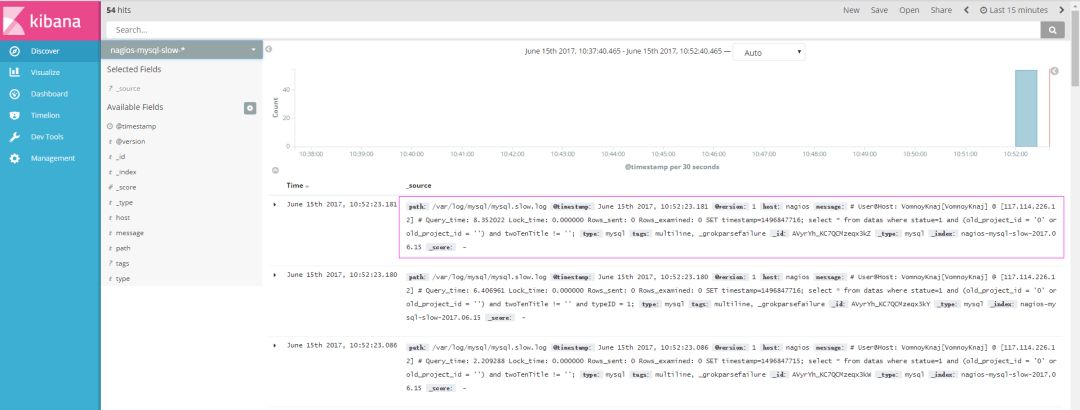
接下来再来一发MySQL慢日志的展示
由于MySQL的慢日志查询格式比较特殊,所以需要用正则进行匹配,并使用multiline能够进行多行匹配(看具体配置)
input {
    file {
        path => "/var/log/messages"
        type => "system"
        start_position => "beginning"
    }

    file {
        path => "/var/log/secure"
        type => "secure"
        start_position => "beginning"
    }

    file {
        path => "/var/log/httpd/access_log"
        type => "http"
        start_position => "beginning"
    }

    file {
        path => "/usr/local/nginx/logs/elk.access.log"
        type => "nginx"
        start_position => "beginning"
    }

    file {
        path => "/var/log/mysql/mysql.slow.log"
        type => "mysql"
        start_position => "beginning"
    codec => multiline {
            pattern => "^# User@Host:"
            negate => true
            what => "previous"
        }
    }
}

filter {

    grok {
        match => { "message" => "SELECT SLEEP" }
            add_tag => [ "sleep_drop" ]
            tag_on_failure => []
    }


    if "sleep_drop" in [tags] {
            drop {}
    }

    grok {
        match => { "message" => "(?m)^# User@Host: %{USER:User}\[[^\]]+\] @ (?:(?\S*) )?\[(?:%{IP:Client_IP})?\]\s.*# Query_time: %{NUMBER:Query_Time:float}\s+Lock_time: %{NUMBER:Lock_Time:float}\s+Rows_sent: %{NUMBER:Rows_Sent:int}\s+Rows_examined: %{NUMBER:Rows_Examined:int}\s*(?:use %{DATA:Database};\s*)?SET timestamp=%{NUMBER:timestamp};\s*(?(?\w+)\s+.*)\n# Time:.*$" }
        }

     date {
            match => [ "timestamp", "UNIX" ]
            remove_field => [ "timestamp" ]
    }


}


output {

    if [type] == "system" {

        elasticsearch {
            hosts => ["192.168.1.202:9200"]
            index => "nagios-system-%{+YYYY.MM.dd}"
        }
    }

    if [type] == "secure" {

        elasticsearch {
            hosts => ["192.168.1.202:9200"]
            index => "nagios-secure-%{+YYYY.MM.dd}"
        }
    }

    if [type] == "http" {

        elasticsearch {
            hosts => ["192.168.1.202:9200"]
            index => "nagios-http-%{+YYYY.MM.dd}"
        }
    }

    if [type] == "nginx" {

        elasticsearch {
            hosts => ["192.168.1.202:9200"]
            index => "nagios-nginx-%{+YYYY.MM.dd}"
        }
    }

    if [type] == "mysql" {

        elasticsearch {
            hosts => ["192.168.1.202:9200"]
            index => "nagios-mysql-slow-%{+YYYY.MM.dd}"
        }
    }
}
查看效果(一条慢日志查询会显示一条,如果不进行正则匹配,那么一行就会显示一条)
具体的日志输出需求,进行具体的分析
三:ELK终极篇
安装reids
修改redis的配置文件
修改内容如下
daemonize yes
bind 192.168.1.202
启动redis服务
测试redis的是否启用成功
输入info如果有不报错即可
redis 192.168.1.202:6379> info
redis_version:2.4.10
....
编辑配置redis-out.conf配置文件,把标准输入的数据存储到redis中
添加如下内容
input {
stdin {}
}
output {
redis {
host => "192.168.1.202"
port => "6379"


