在上篇文章里,提到了高频交易需要仔细研究订单队列(OrderBook),本节介绍订单队列的基本知识。
本文包括如下几个部分:
-
什么是订单队列?
-
如何构建订单队列?
-
队列深度图是怎么回事?
-
如何用python画自己的队列深度图?
什么是订单队列?
订单队列就是在交易所排队的未成交订单的信息。比如在某个瞬间,GDAX交易所BTC-USD的订单队列如下:
6744.680000 0.100000 sell
6744.000000 0.001000 sell
6743.550000 1.400000 sell
6743.540000 0.100000 sell
6743.480000 0.002000 sell
6743.220000 0.001000 sell
6743.010000 1.000000 sell
6742.810000 2.500000 sell
6742.250000 3.502058 sell
6741.020000 13.092218 sell
---------------------------
6741.010000 0.331101 buy
6741.000000 0.001000 buy
6740.990000 0.005558 buy
6740.460000 0.001000 buy
6740.340000 0.100000 buy
6740.170000 0.001000 buy
6740.130000 0.010571 buy
6740.000000 0.241145 buy
6739.990000 0.348368 buy
6739.880000 0.003147 buy
交易所在发布订单队列时,相同价位的订单数量会合并计算。
如何构建订单队列?
在我们做高频交易时,需要及时更新订单队列,计算高频信号。那如何构建自己的订单队列呢?
各个交易所提供的技术解决方案雷同,都是用推送的方式,将订单簿的更新信息推送到用户。
以GDAX交易所为例子,它会通过WebSocket接口中的level2频道,推送订单簿的变化信息。API原文如下:
-
The easiest way to keep a snapshot of the order book is to use the level2 channel. It guarantees delivery of all updates, which reduce a lot of the overhead required when consuming the full channel.
-
When subscribing to the channel it will send a message with the type snapshot and the corresponding product_id. bids and asks are arrays of [price, size] tuples and represent the entire order book.
-
Subsequent updates will have the type l2update. The changes property of l2updates is an array with [side, price, size] tuples. Please note that size is the updated size at that price level, not a delta. A size of "0" indicates the price level can be removed.
也就是通过三步:
-
订阅level2频道。
-
接收当前全量的订单簿。
-
接收订单簿的更新。
用户可以在内存中根据交易所返回的信息,构建最新的订单簿。python代码如下:
from sortedcontainers import
SortedDict
import matplotlib.pyplot as plt
class Order():
def __init__(self, price, size, action):
self.price = price
self.size = size
self.action = action
class OrderBook():
def __init__(self):
self.bids = SortedDict()
self.asks = SortedDict()
# process orderbook update
def process(self, data):
for k, v in data.items():
if v.action == 'buy':
self
.bids[k] = v
if v.size == 0.0:
self.bids.pop(k)
elif v.action == 'sell':
self.asks[k] = v
if v.size == 0.0:
self.asks.pop(k)
def show(self, depth):
for k in (self.asks.keys())[depth::-1]:
print('%.6f %.6f %s' % (k, self.asks[k].size, self.asks[k].action))
for k in (self.bids.keys())[-1:-depth:-1]:
print('%.6f %.6f %s' % (k, self.bids[k].size, self.bids[k].action))
通过websocket接收推送数据
from websocket import create_connection
import json
if __name__ == '__main__':
while(1):
try:
ws = create_connection("wss://ws-feed.gdax.com")
break
except:
print('connect ws error,retry...')
time.sleep(5)
subscribeStr="""{"type": "subscribe","product_ids": ["BTC-USD"], "channels": [{"name":"level2", "product_ids":["BTC-USD"]}]}"""
ws.send(subscribeStr)
orderbook = OrderBook()
i = 0
while(1):
recvData=ws.recv()
result = json.loads(recvData)
res_type = result['type']
data = {}
if res_type == 'snapshot':
bids = result['bids']
for value in bids:
price = float(value[0])
size = float(value[1])
data[price] = Order(price,
size, 'buy')
asks = result['asks']
for value in asks:
price = float(value[0])
size = float(value[1])
data[price] = Order(price, size, 'sell')
if res_type == 'l2update':
changes = result['changes']
for value in changes:
side = value[0]
price = float(value[1])
size = float(value[2])
data[price] = Order(price,
size, side)
orderbook.process(data)
# display top 10 orders
orderbook.show(10)
队列深度图是怎么回事?
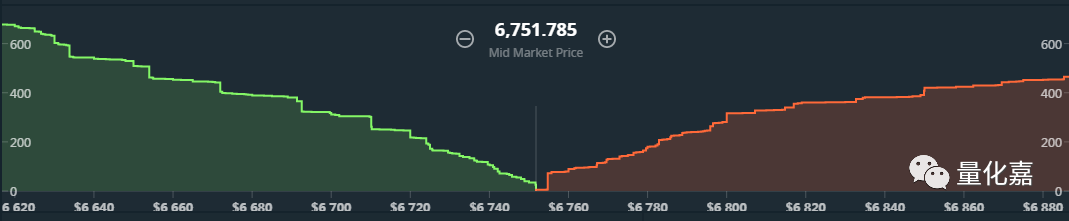
这是一幅GDAX上的BTC-USD队列深度图,用来描述买卖订单的平衡情况。其中:
-
mid market price = (best bid price + best ask price) / 2
-
X轴表示价格,Y轴表示累计的订单大小。即表示以此价格可以获得(买到或者卖掉)的最大数量。
队列深度图可以作为描述市场力量平衡的一个指标,但不能完全按照队列深度图操作,因为:
-
订单还有可能被撤销
-
离mid market price越远的订单,真实性越低。有可能是某些人故意放进来干扰的。
如何用python画自己的队列深度图?
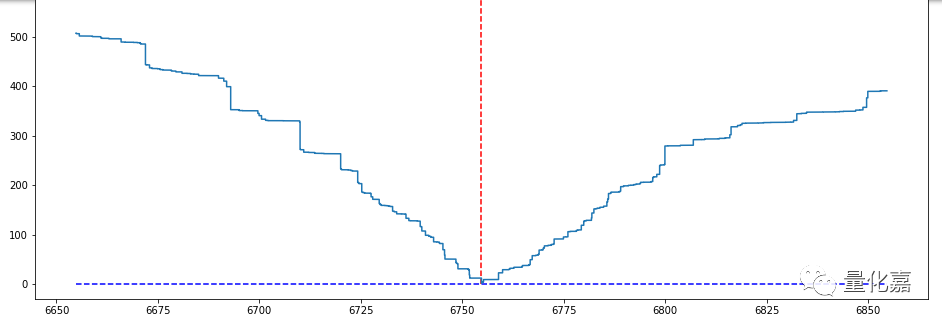
队列深度图是一个阶梯图,直接上python代码:
from collections import OrderedDict
from sortedcontainers import SortedDict
import matplotlib.pyplot as plt
class OrderBook():
def __init__(self):
self.bids = SortedDict()
self.asks = SortedDict()
def process(self, data):
for k, v in data.items():
if v.action == 'buy':
self.bids[k] = v
if v.size == 0.0:
self.bids.pop(k)
elif v.action == 'sell':
self.asks[k] = v
if v.size == 0.0:
self.asks.pop(k)
def show(self, depth):
for k in (self.asks.keys())[depth::-1]:
print('%.6f %.6f %s'
% (k, self.asks[k].size, self.asks[k].action))
for k in (self.bids.keys())[-1:-depth:-1]:
print('%.6f %.6f %s' % (k, self.bids[k].size, self.bids[k].action))
def draw_depth(self, width):
bid = self.bids.keys()[-1]
ask = self.asks.keys()[0]
mid = (bid+ask) / 2.0
print('mid=%.6f' % (mid))
steps = width * 10
ask_x = [mid + float(i) * 0.1 for i in range(steps)]
bid_x = [mid - float(i) * 0.1 for i in range(steps)]
cum_size = 0.0
cum_data = OrderedDict()
for k, v in self.asks.items():
price = k
size = v.size
cum_size = cum_size + size
cum_data[price] = cum_size
ask_y = []
start
= 0
for k, v in cum_data.items():
price = k
size = v
if start >= len(ask_x):
break
for i in range(start, len(ask_x)):
cum_value = 0.0
if ask_x[i] <= price:
cum_value = size
ask_y.append(cum_value)
else:
start = i
break
if len(ask_y) >= len(ask_x):
break
cum_size = 0.0
cum_data = OrderedDict()
for k in reversed(self.bids):
price = k
size = self.bids[k].size
cum_size = cum_size + size
cum_data[price] = cum_size
bid_y = []
start = 0
for k, v in cum_data.items():
price = k
size = v
if start >= len(bid_x):
break
for i in range(
start, len(bid_x)):
cum_value = 0.0
if bid_x[i] >= price:
cum_value = size
bid_y.append(cum_value)
else:
start = i
break
if len(bid_y) >= len(bid_x):
break;
bid_x.reverse()
bid_y.reverse()
bid_x.extend(ask_x)
bid_y.extend(ask_y)
fig, ax = plt.subplots(figsize=(16,6))
ax.vlines(mid, 0, 600, color='red', linestyle='--')
ax.hlines(0, mid-width, mid+width, color='blue', linestyle='--')
ax.step(bid_x, bid_y)
plt.show()
# call function
orderbook.draw_depth(100)
输出结果是这个样子的: