
一、指数概览
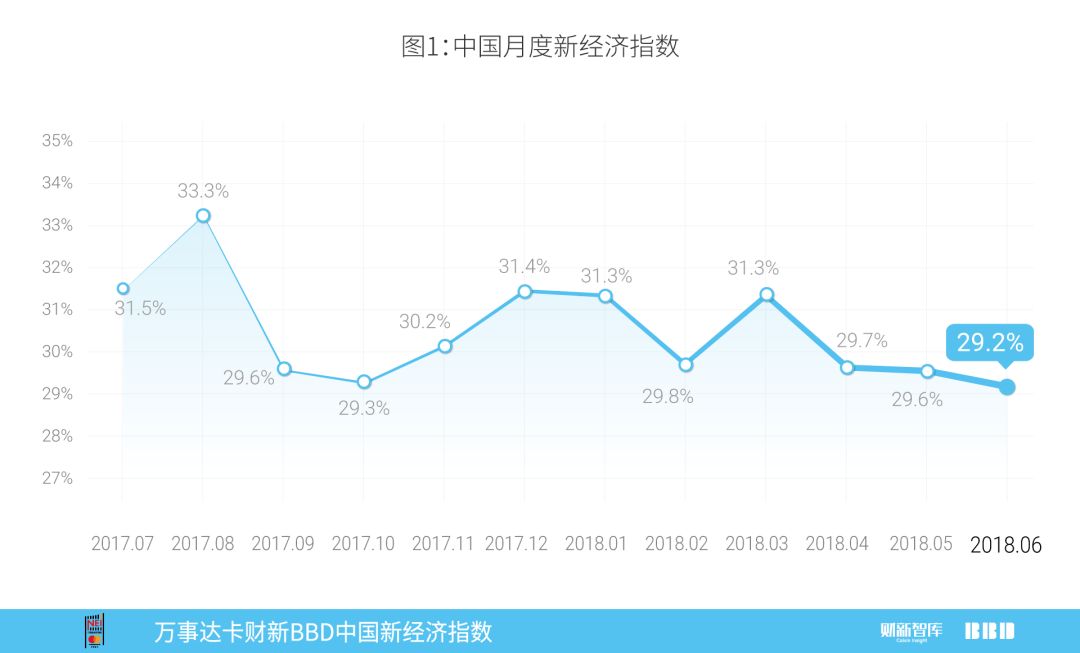
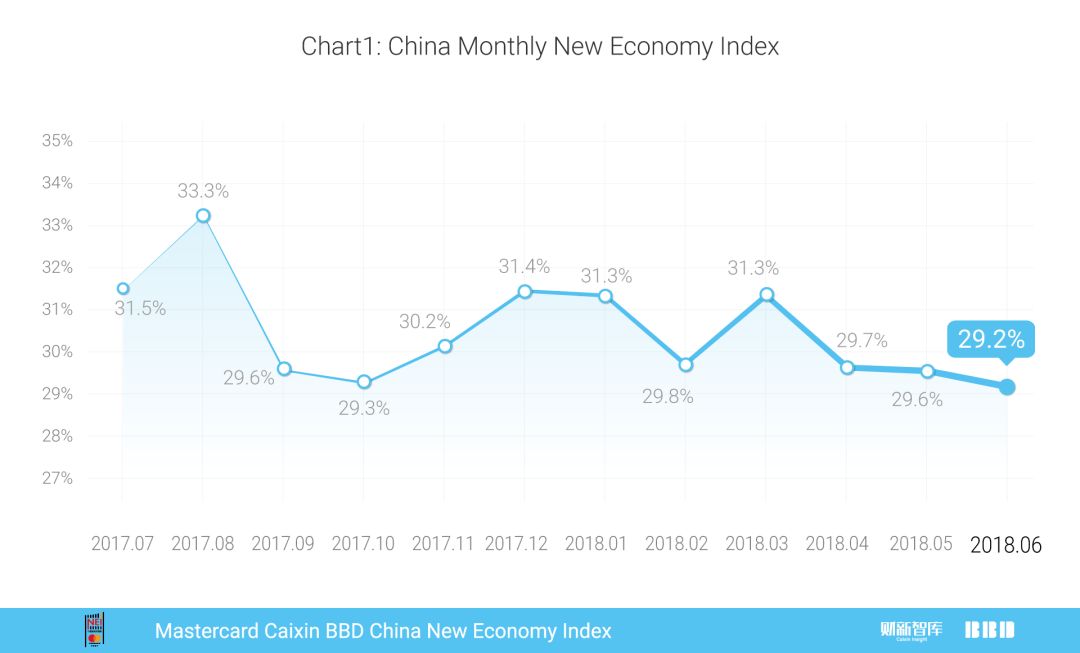
2018年6月,万事达卡财新BBD中国新经济指数(NEI)录得29.2,即新经济投入占整个经济投入的比重为29.2%。2017年以来,NEI指数波动较大,按可比口径计算,本月NEI比上月下降0.4个百分点(图1)。本月NEI的下降主要来自科技投入的下降。
NEI新经济据于以下定义:首先,高人力资本投入、高科技投入、轻资产;其次,可持续的较快增长;第三,符合产业发展方向。NEI所含行业详见《万事达卡财新BBD中国新经济指数技术报告》与《万事达卡财新BBD中国新经济指数报告(2017年3月)》。
二、主要分项指标
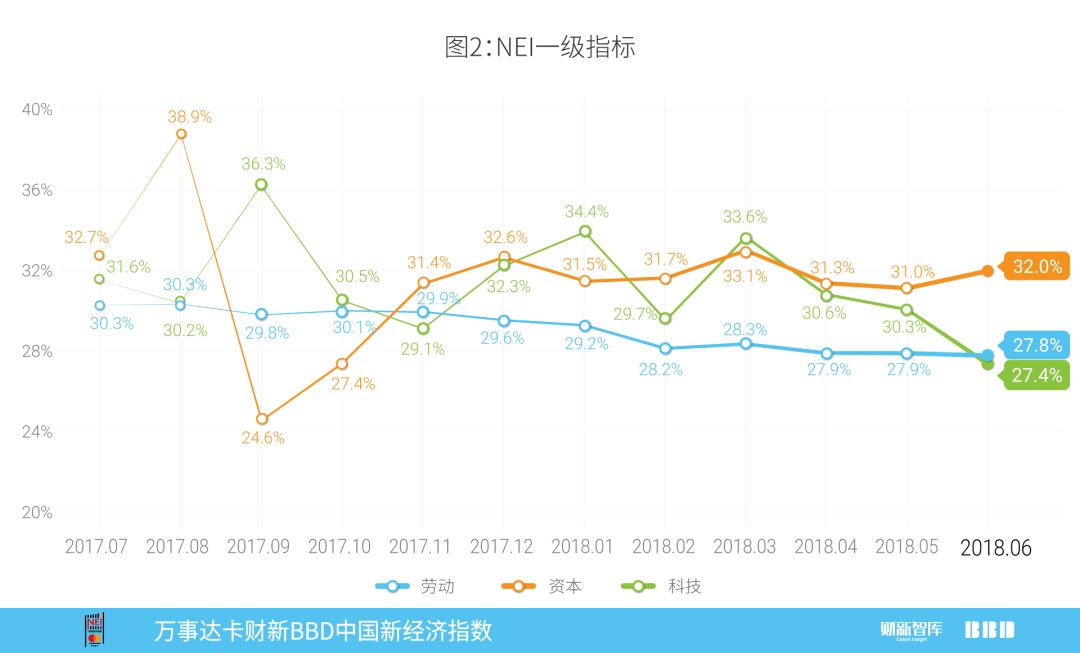
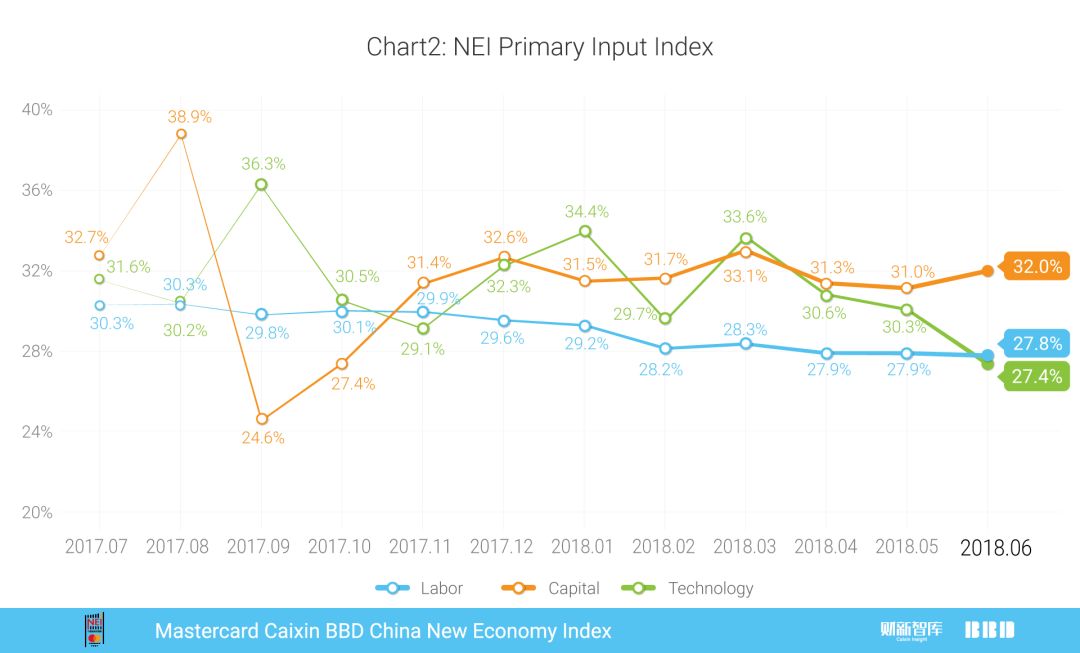
NEI包括劳动力、资本和科技三项一级指标,它们在NEI中的权重分别是40%、35%和25%。2018年6月NEI的下降主要来自科技投入的下降。科技投入指数从2017年10月开始呈现震荡走势,本月指数录得27.4,环比下降2.9。资本投入指数从2018年3月以来缓慢下降,本月有所回升,指数录得32.0,环比上升1.0。劳动力投入指数自2017年7月以来持续缓慢下降,本月指数录得27.8,环比微降0.1(图2)。
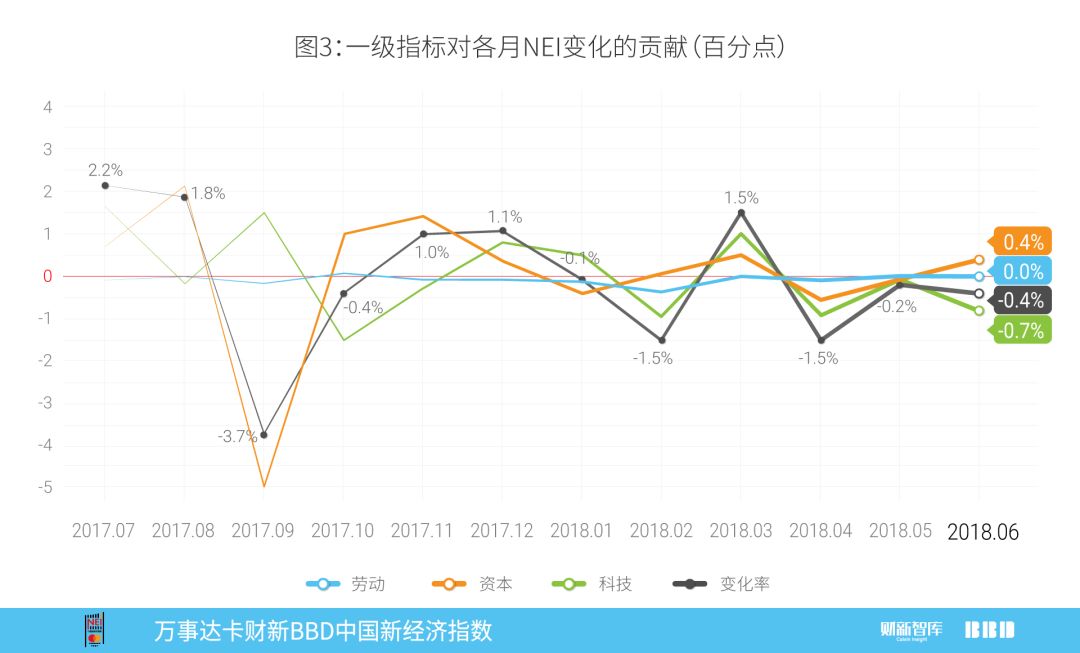
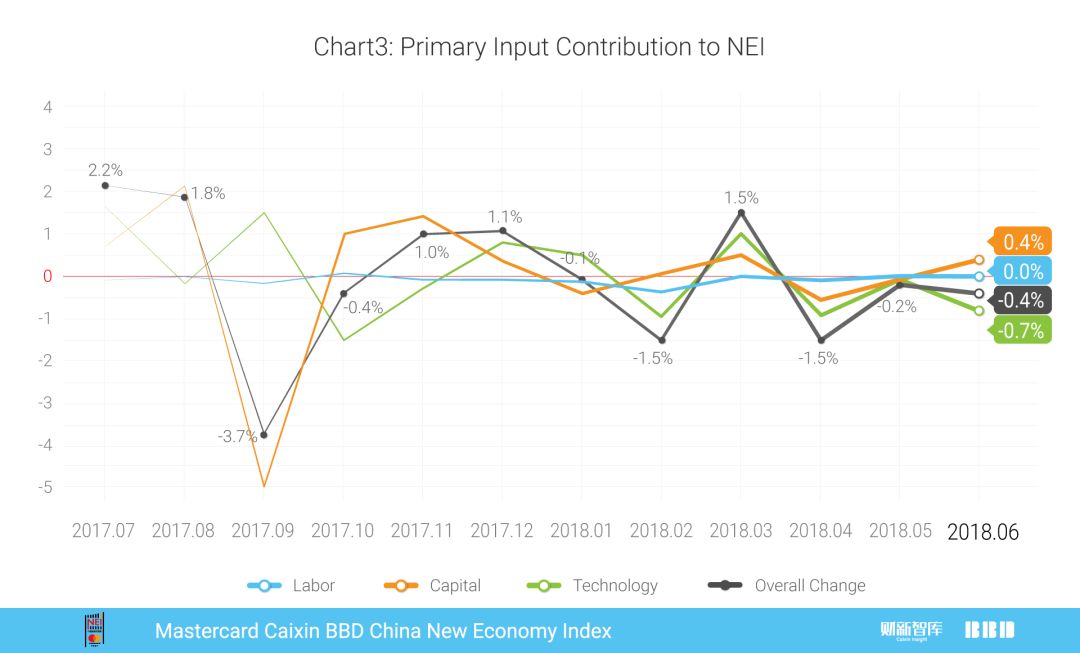
劳动力、资本和科技投入的变化绝对值分别为0.0,0.4,和-0.7个百分点,与权重相乘求和后,对2018年6月NEI变化的贡献值为-0.4(图3)。
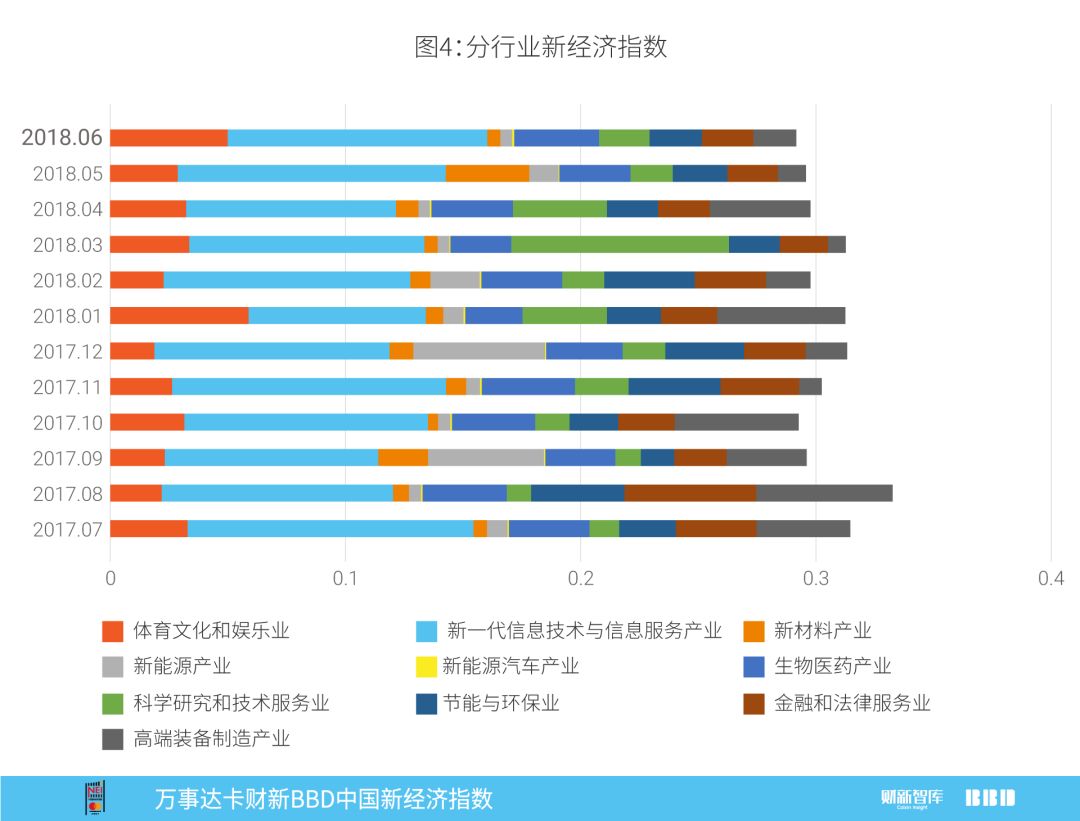
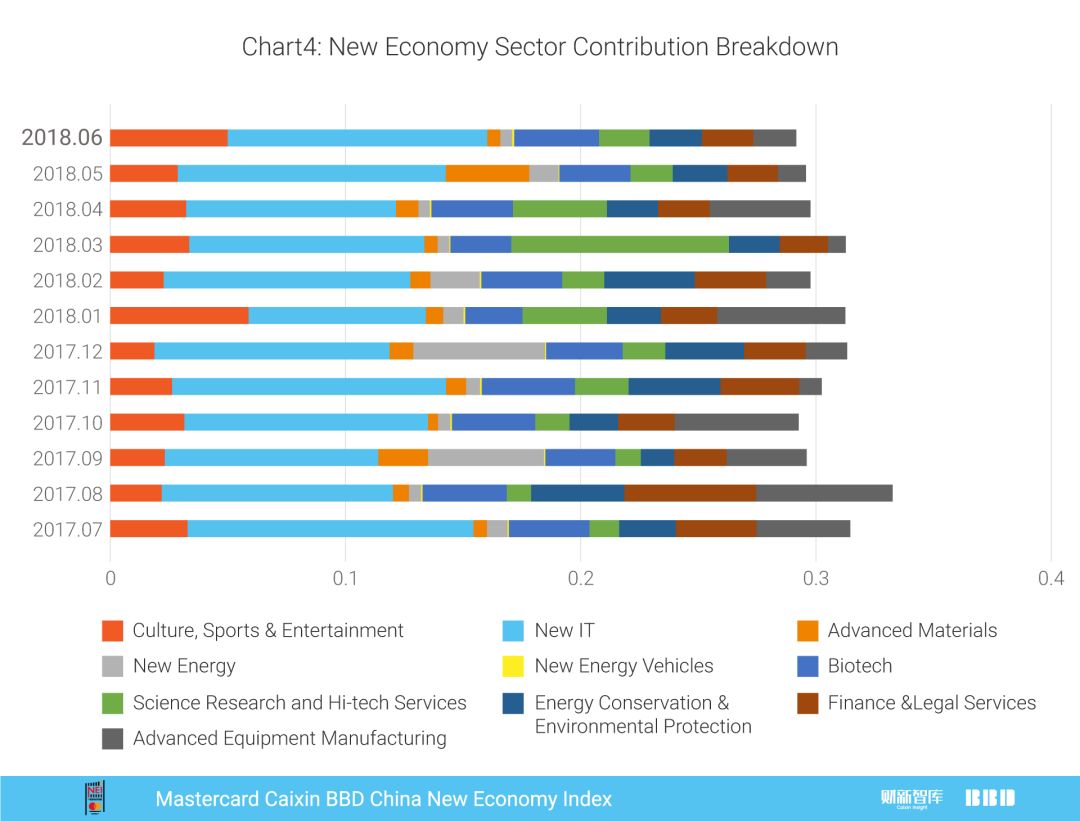
分行业看,NEI中占比最大的行业为新一代信息技术与信息服务产业,2018年6月为总指数贡献了11.0个百分点;本月名次上升最快的行业为体育文化和娱乐业,贡献率为5.0个百分点,位列第二名;新材料产业贡献率排名下降最多,从上月的第二名下降至本月第八名,贡献率为0.6个百分点(图4)。
三、新经济就业
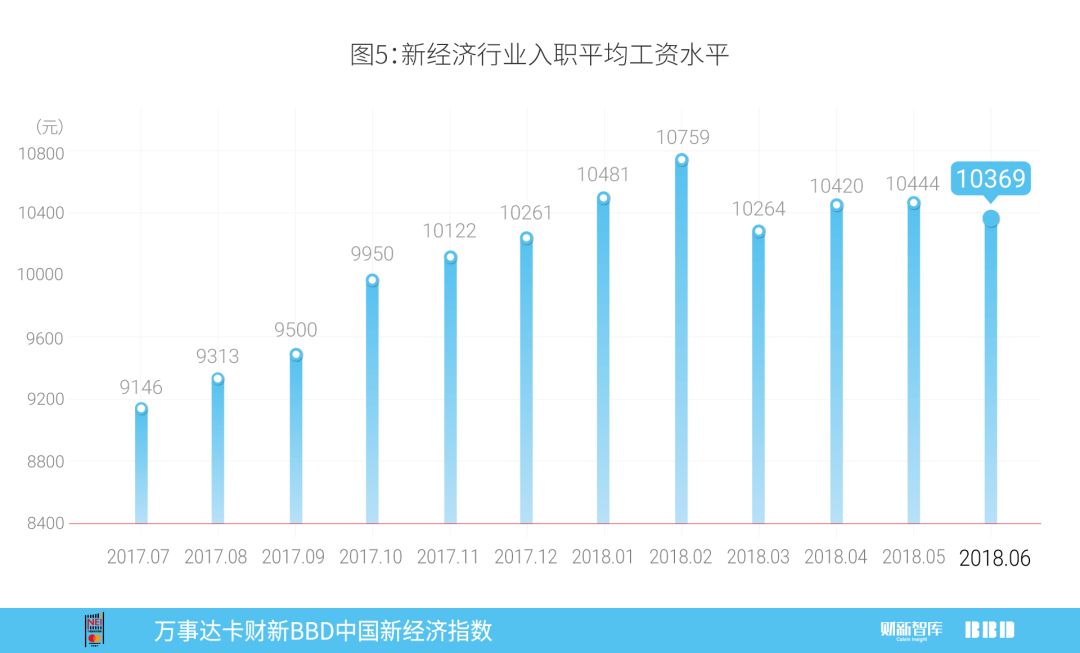
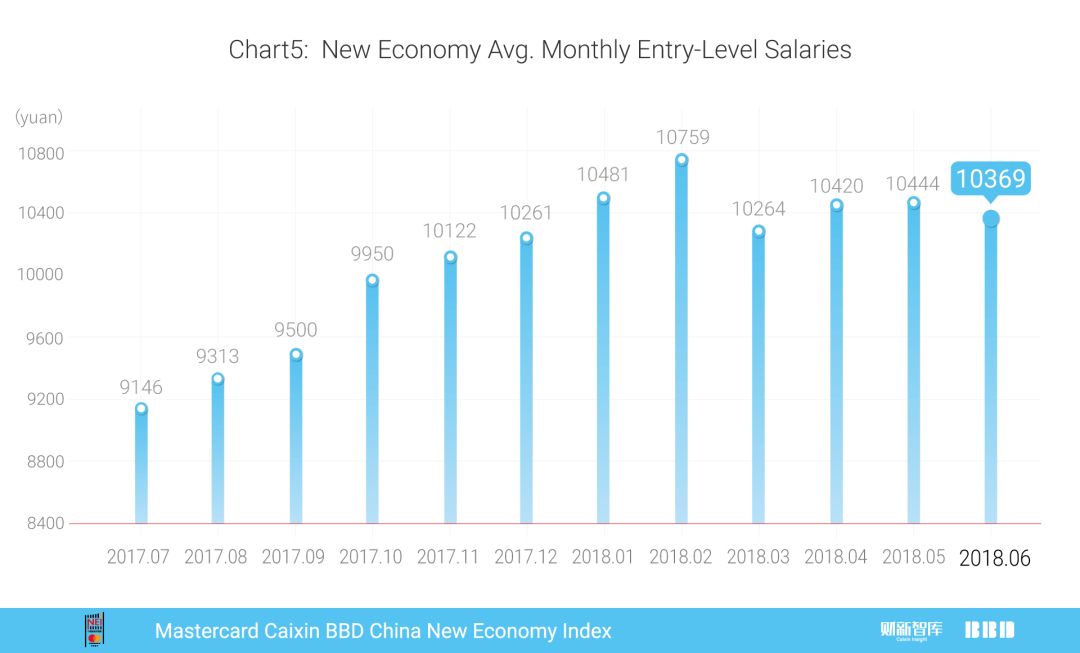
2018年6月,新经济行业入职平均工资水平环比下降,为每月10369元,较上月下降75元(图5)。新经济工资主要来自51job、智联招聘、拉钩、赶集网等数个招聘网站的招聘信息,即对劳动力的需求工资。
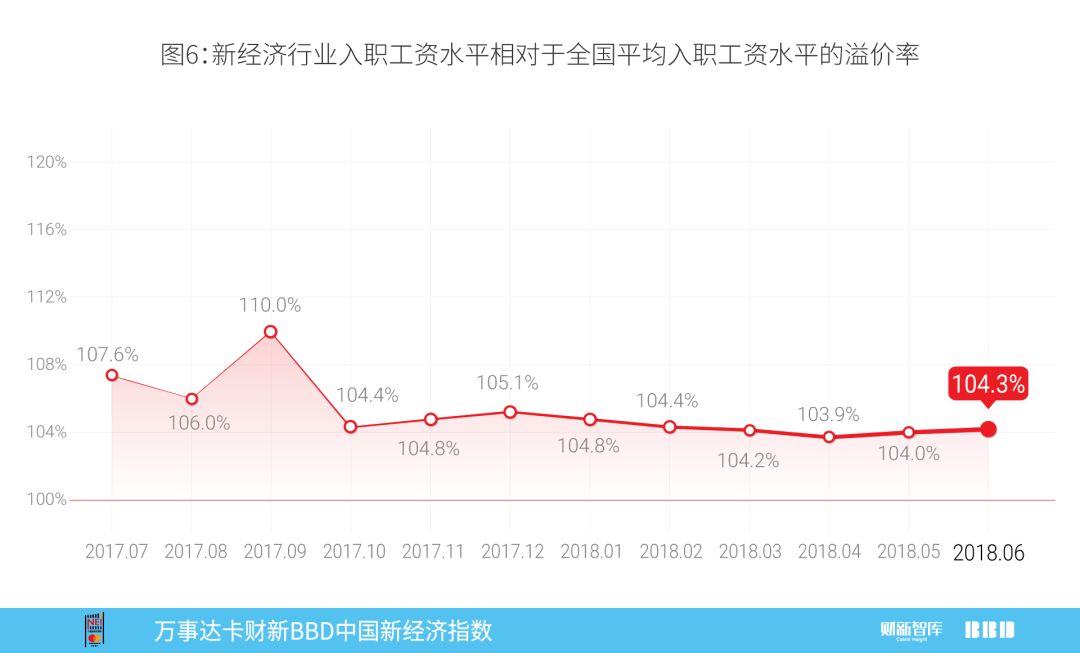
2018年6月新经济行业招聘人数占全国总招聘人数比例略有下降,为27.25%,同时新经济行业招聘总薪酬占全国总薪酬比重保持不变,仍为28.4%,这意味着新经济行业的平均入职工资水平相对于全国平均入职工资水平略有上升。2018年6月新经济入职工资“溢价”为4.3%,高于上月4.0%(图6)。最近一年新经济行业的平均工资溢价总体低于2017年上半年新经济行业的平均工资溢价,但近两月有所回升。
四、从新增企业数据看投资行业变化
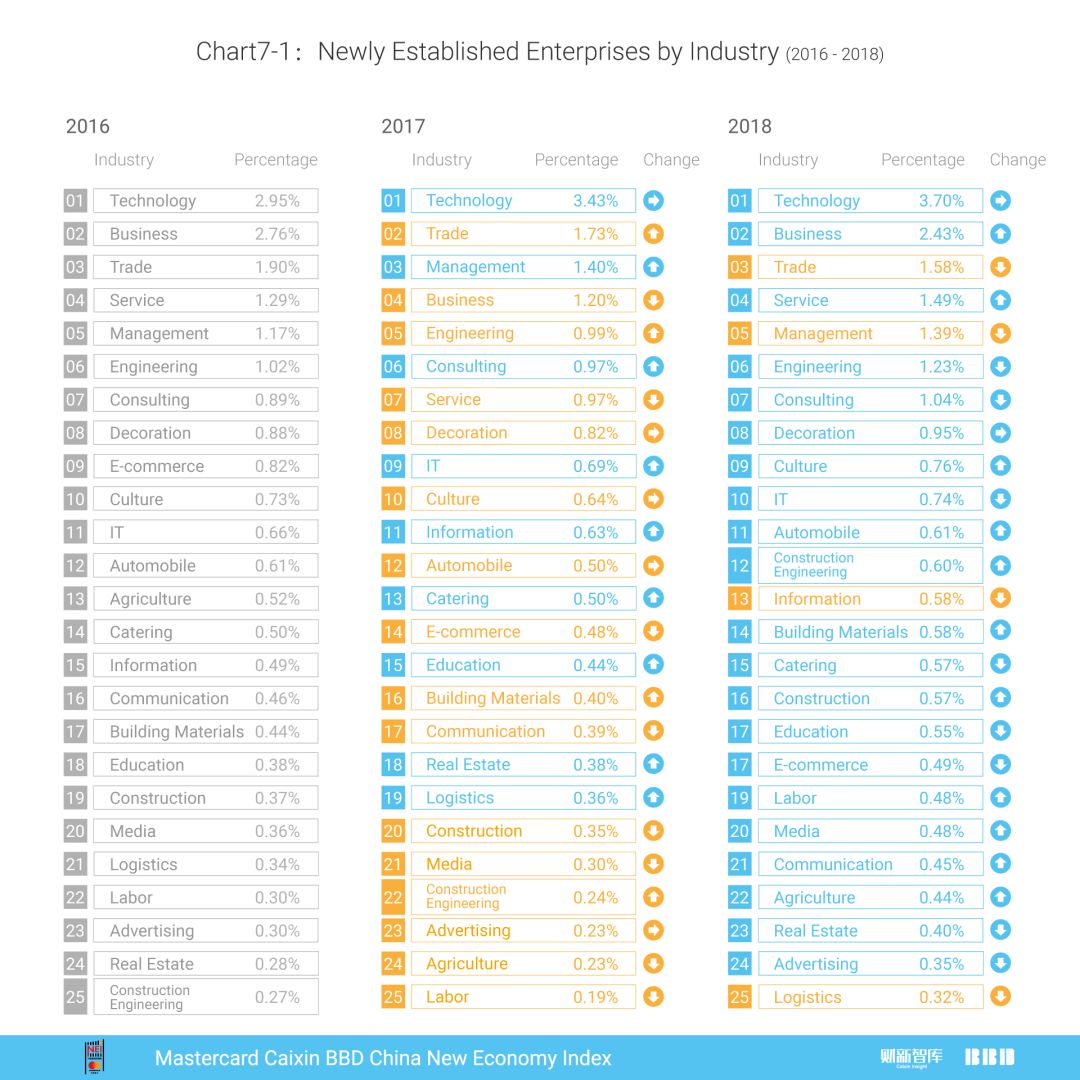
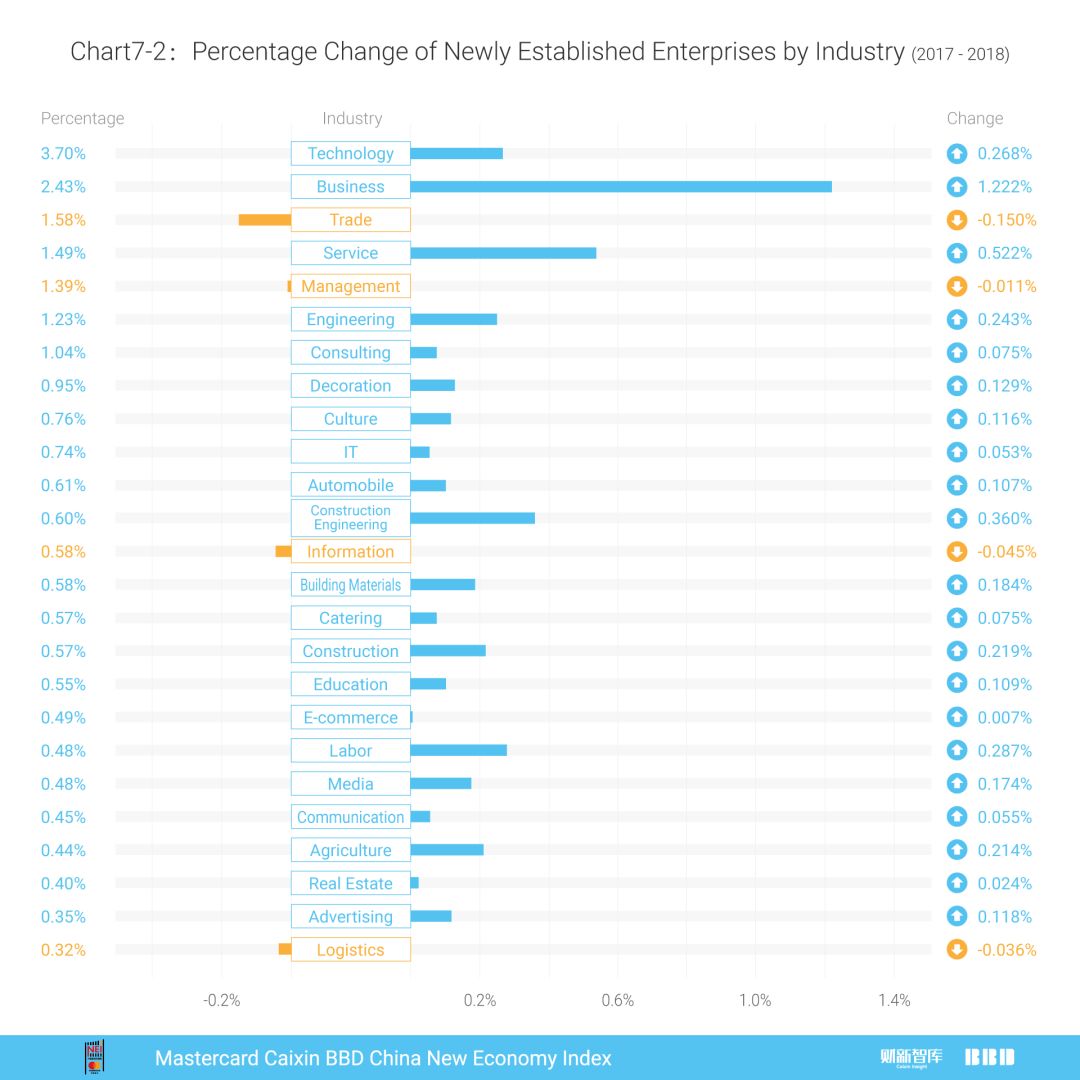
使用新增企业数据,我们可以对近两年来各行业新增企业占总新增企业比重进行监测,见图7。
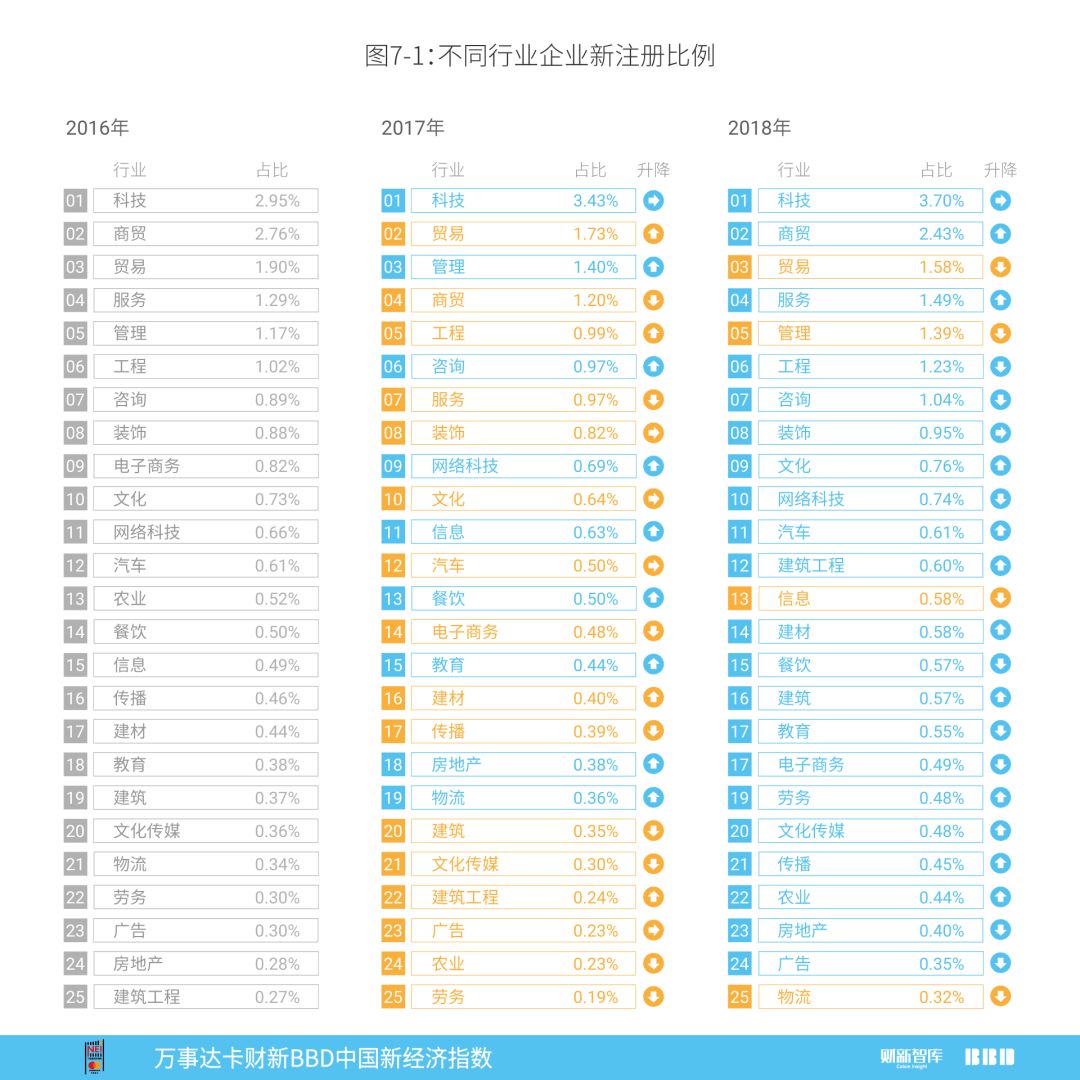
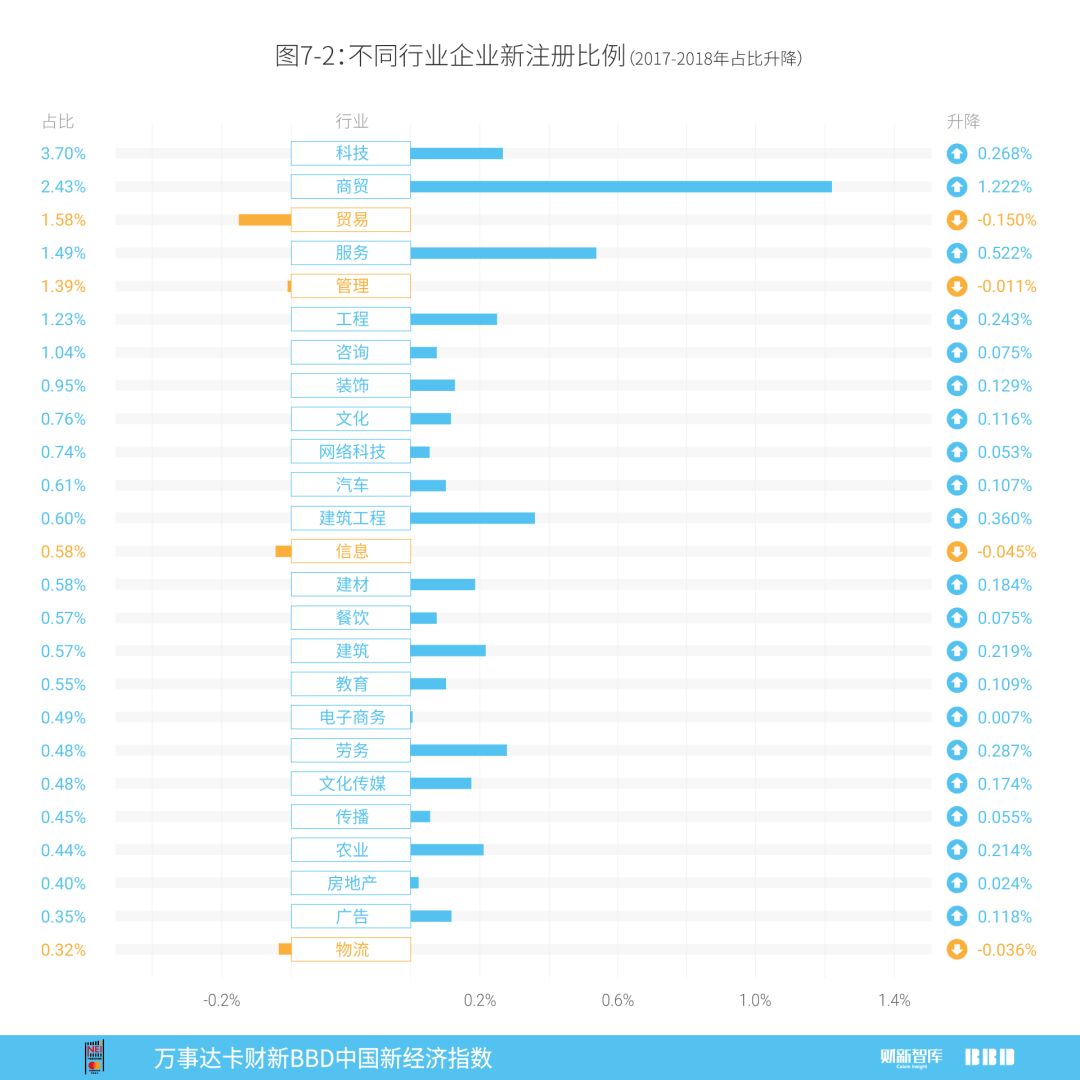
排名近两年连续上升的行业包括以下几类:建筑工程,2016年位列第25名,2017年上升到第22名,2018年继续上升到第12名,2017和2018年占比分别下降0.03%和上升0.36%;建材,2016年位列第17名,2017年上升到第16名,2018年上升到第14名,2017和2018年占比分别下降0.04%和上升0.18%。
排名近两年持续下降的行业包括以下几类:传播,2016年位列第16名,2017年下降到第17名,2018年继续下降到第21名,2017和2018年占比分别下降0.06%和上升0.05%;电子商务,2016年位列第9名,2017年下降到第14名,2018年继续下降到第18名,2017和2018年占比分别下降0.34%和上升0.01%。
排名在近两年之间波动变化的行业包括以下几类:信息,2016年位列第15名,2017年上升到第11名,2018年下降到第13名;教育,2016年位列第18名,2017年上升到第15名,2018年下降到第17名;物流,2016年位列第21名,2017年上升到第19名,2018年下降到第25名;房地产,2016年位列第24名,2017年上升到第18名,2018年下降到第23名;农业,2016年位列第13名,2017年下降到第24名,2018年上升到第22名;服务,2016年位列第4名,2017年下降到第7名,2018年上升到第4名;劳务,2016年位列第22名,2017年下降到第25名,2018年上升到第19名;商贸,2016年位列第2名,2017年下降到第4名,2018年上升到第2名;此外,网络科技、建筑、贸易、咨询、工程、餐饮、文化传媒等行业排名也在近两年之间小幅波动变化。
五、从劳动力需求数据看工业增加值增速
在上个月,我们使用“普工/操作工”招聘数量,对全国和不同地区的工业增加值进行统计分析,并得到了非常好的结果,说明该指标能够帮助我们对地区工业增长起到预警和监测的作用。
本月,我们着重进行分地区的分析。在图8中,我们对2018年第二季度各地区普工/操作工招聘数量计算年度同比增长率,并与各地区的5月份工业增加值当月同比增长进行比较,两者的正相关关系十分显著,体现了普工/操作工的同比增长和工业增加值同比增长同向运动的概念。我们将图8分为四个象限,可以看到绝大部分地区落在第一、第三象限中,表示该地区的工业增加值同比增长和「操作工/普工」同比增长呈现同向运动。
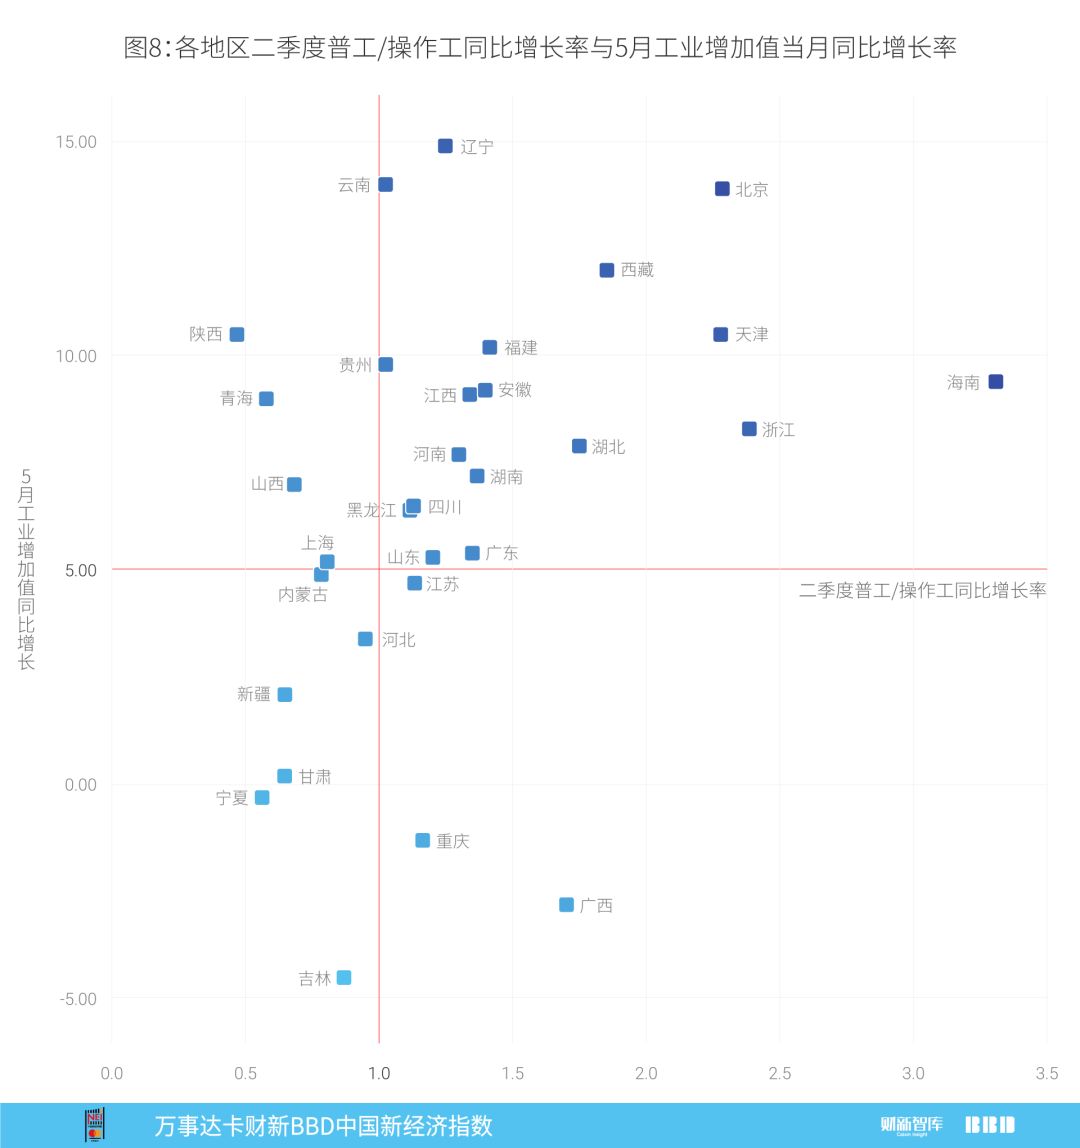
但在第二、第四象限中仍然存在例外,其中第二象限表示该区间的工业增加值增长速度远高于相应劳动力岗位的增加,包括陕西、青海与山西。而第四象限则表示该地区的工业增加值增长速度低于相应劳动力岗位的增加,包括重庆、广西。
这些例外意味着该地区的统计数据和企业行为大数据出现了背离,需要我们在未来进一步关注。
六、从机场人口流动看经济走势
在图9中,我们对不同地区的机场在这两年来的变化进行了环比描绘。可以看到,图9-1中的一线城市机场和图9-2中的二、三线城市机场的人口流量走势出现了显著差异。近两年来,大城市的机场人口流量上升幅度远小于二、三线城市,大多走势平缓,以2016年4月为基准的话,增幅一般不超过50%,如上海、北京、广州机场,常年人口流动稳定。而二线城市机场的人口流量则有较大差异,往往会出现超过100%的变化,其中石家庄机场增长最为迅速,在2017年10月,其人口净流入量达到了2016年4月的6.2倍。
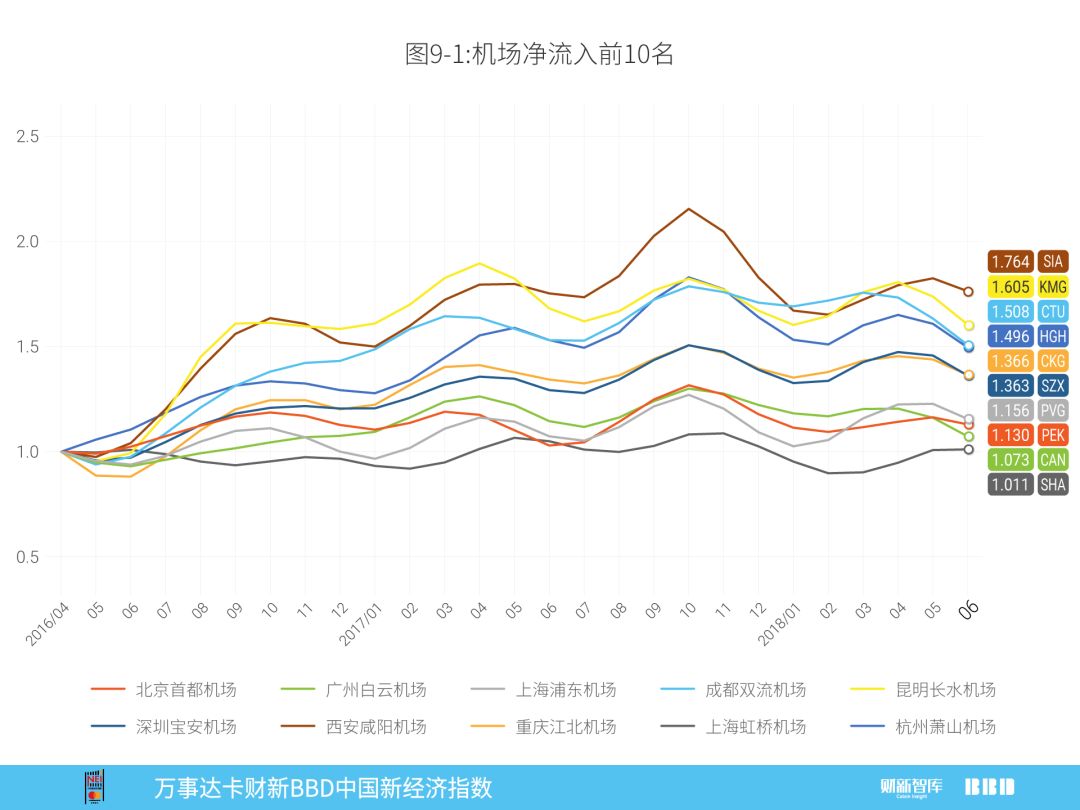
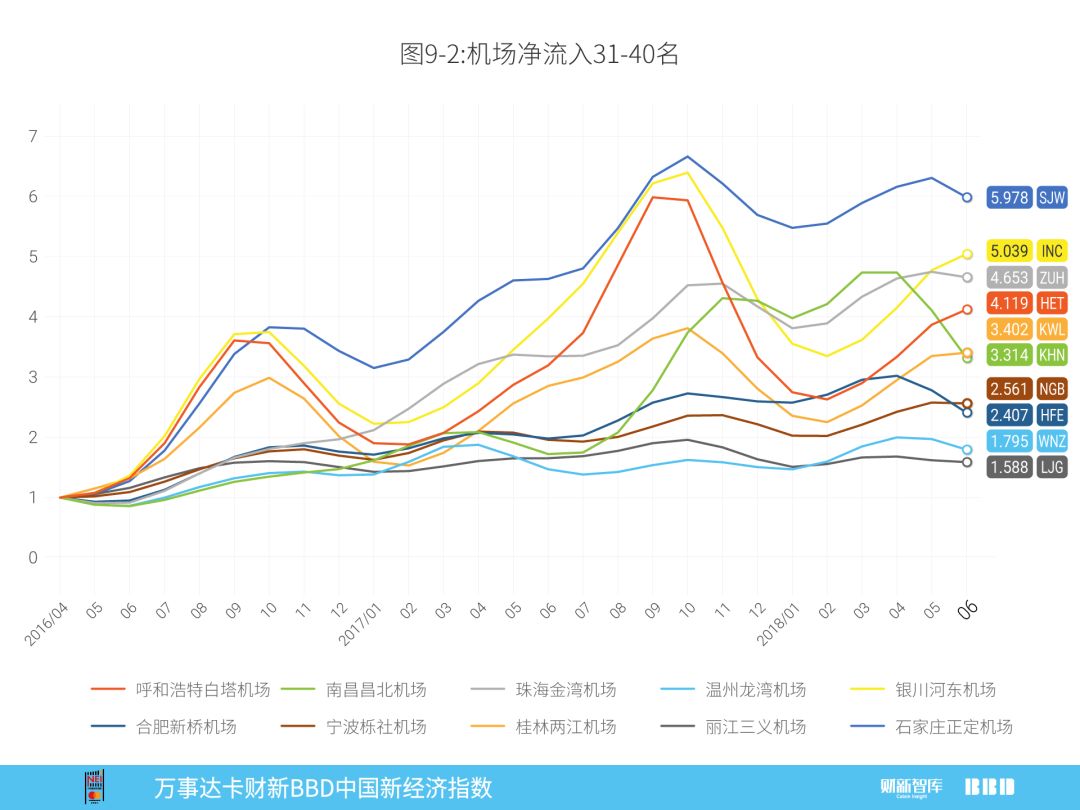
从两组机场流量比较中我们也能观察到一个倒U形的走势曲线,其中最大值出现在2017年10月左右,随后便开始逐渐下降。该指标和工业增加值、固定资产投资走势也十分类似,意味着中国目前正在走向一个经济下滑区间,且暂时没有回暖的迹象。
七、城市新经济排名
2018年6月新经济总量指数城市排名前20名如图10所示,北京、上海、广州、深圳、南京排名前五。该排序计算每个投入指标在所有城市中的排序百分位,再将百分位加权平均,体现的是近半年城市间新经济总量排名。
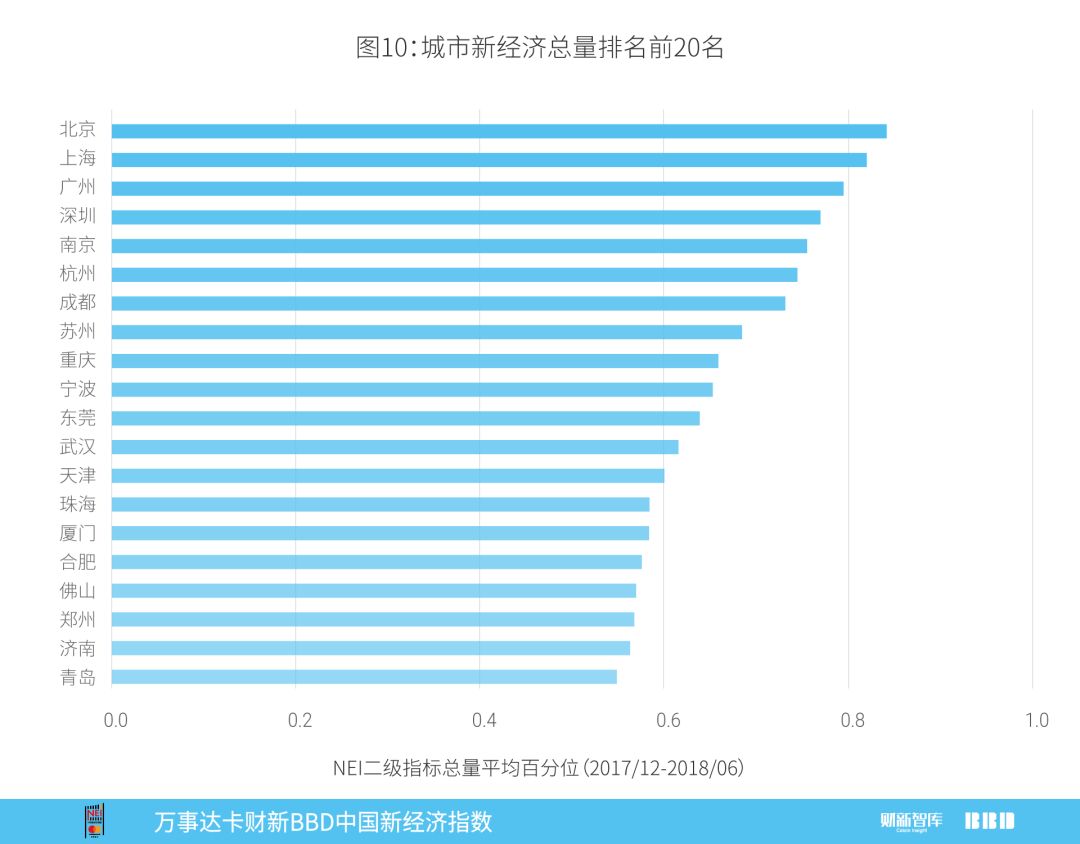
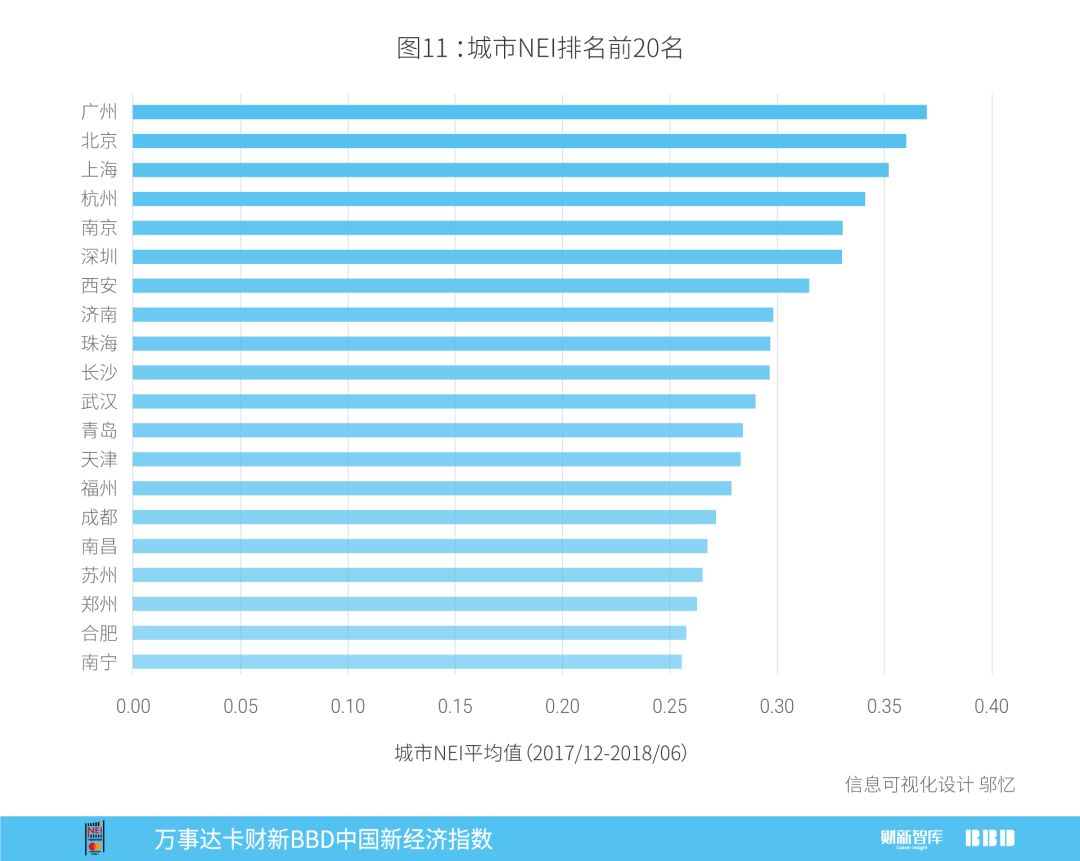
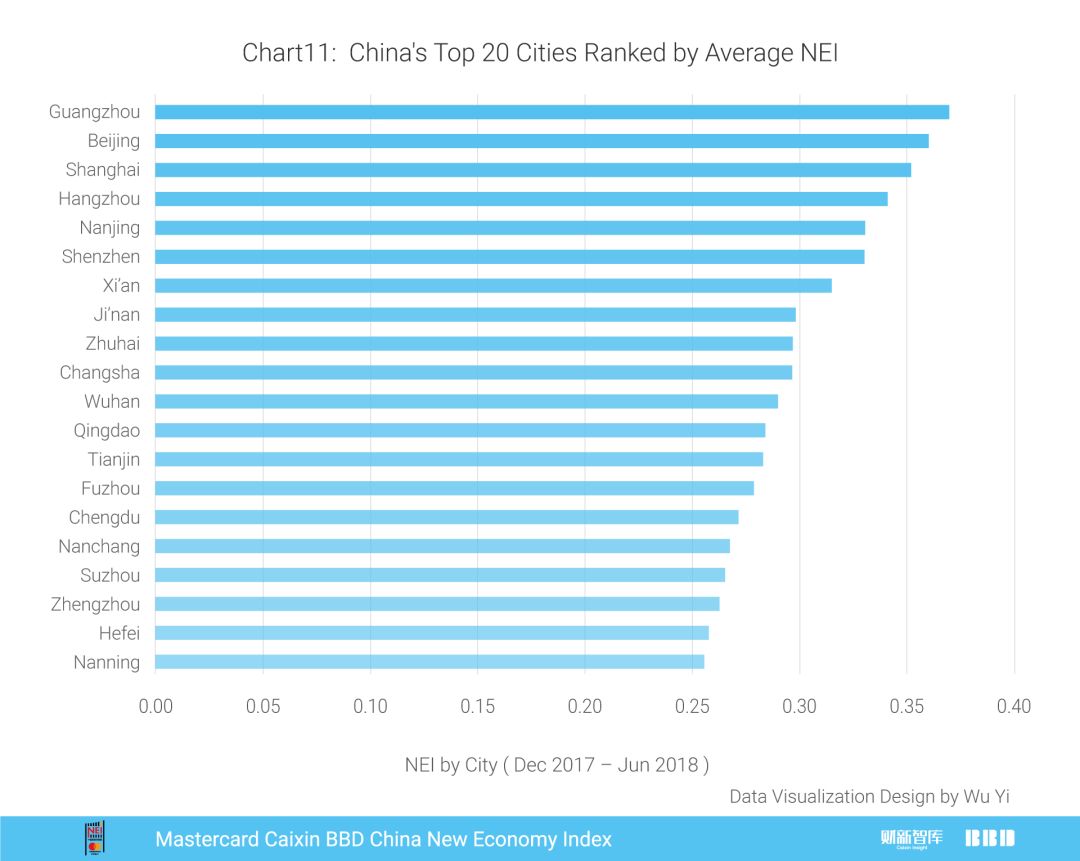
图11计算了2017年12月到2018年6月城市NEI平均排名,前五名为广州、北京、上海、杭州、南京。
更多咨询敬请联络:
万事达卡
大中华区公共关系副总裁 吴焕宇
电话:+86-10-8519-9304
电邮:[email protected]
财新智库
财新智库高级经济学家 王喆
电话:+86-10-85905019
电邮:[email protected]
公关总监 马玲
电话:+86-10-8590-5204
电邮:[email protected]
BBD(数联铭品)
BBD(数联铭品)首席经济学家 陈沁
电话:+86-28-65290823
电邮:[email protected]
版权声明
万事达卡财新BBD中国新经济指数,是由财新智库(深圳)投资发展有限公司和成都数联铭品科技公司共同研发,与北京大学国家发展研究院合作,经过近一年努力,于2016年3月2日在北京首发的指数产品,此后每月2日上午10:00发布上月数据。
关于万事达卡:
万事达卡(纽交所股票交易代码:MA),
www.mastercard.cn
,是全球性的支付与科技公司。通过运营全球最快的支付处理网络,万事达卡将超过210个国家和地区的消费者、金融机构、商户、政府和企业连接在一起。万事达卡的产品和解决方案使得每个人在购物、旅行、企业经营、财务管理等日常商业活动都变得更容易、更安全和更高效。敬请关注我们的“万事达卡”官方微信以及在新浪的官方微博@万事达人,以获悉动态并参与互动。也可访问万事达卡新闻中心或万事达卡互动中心获取更多资讯。
关于财新:
财新传媒是提供财经新闻的全媒体集团,依托专业的团队和强大的原创新闻优势,以网站、移动端、期刊、视频、图书、会议等 多层次的业务平台,为中国最具影响力的受众群,提供准确、全面、深入的财经新闻产品。财新智库是财新传媒通过孵化另行建立的高端金融资讯服务平台,旨在通过发展金融数据业务,壮大宏观经济研究队伍,服务于智库业务客户。详细信息,敬请浏览
www.caixin.com
。
关于BBD:
BBD(数联铭品)是行业领先的大数据解决方案提供商,紧密围绕新经济,通过动态尽调、信用评级、风险定价和经济指数四个步骤,BBD提供从微观到宏观的大数据服务。详细信息,敬请浏览:
http://www.bbdservice.com
。
June
2018
Mastercard Caixin BBD China New Economy Index
Overview
In June 2018, the Mastercard Caixin BBD New Economy Index (NEI) reading came in at 29.2, indicating that the New Economy accounted for 29.2% of overall economic input activities that month, down 0.4 ppts from May (Chart 1). The declining NEI was due to the decrease of technology input. New economy is defined as following: 1) human capital intensive, technology intensive and capital light; 2) sustainable rapid growth, and 3) in line with the strategic new industries defined by the government. Please refer to our previous reports (March 2016 and March 2017) for the list of NEI sectors.
Primary Inputs
The NEI includes labor, capital and technology inputs that account for 40%, 35% and 25% of the total weights of the index, respectively. The decline in the June NEI reading came from the decrease of technology input (Chart 2). Technology input index fluctuated widely since October 2017, coming in at 27.4, with 2.9 MoM decrease. Capital investment showed a slow downtrend since March 2018, but it rose slightly to 32.0 this month, with 1.0 MoM increase. Labor input index declined moderately since July 2017, dropping to 27.8 this month, with 0.1 MoM decrease.
Taking the weight into account, percentage changes in labor, capital and technology inputs were 0.0, 0.4, and -0.7 ppts, respectively. The net NEI change was -0.4 ppts in total (Chart 3).
Looking at the sectors, the New IT industry formed the largest proportion of the New Economy Index, contributing 11.0 ppts to NEI. Culture, Sports & Entertainment was the industry with fastest growth in June, contributing 5.0 ppts and ranking the second. Advanced Materials came eighth from second, the biggest drop in ranking, contributing 0.6 ppts in June (Chart 4).
New Economy Employment
In June 2018, the average monthly entry level salary of the New Economy was RMB 10,369 per month, decreasing from last month’s level of RMB 10,444 (Chart 5). New Economy wage information is compiled from online websites of career platforms and recruitment services including 51job and Zhaopin, as well as other sites that list job openings.
Hiring in the New Economy sectors accounted for 27.25% of total hiring in June, slightly lower than the previous month’s 27.3%. At the same time, the total compensation share of New Economy sectors remained stable to 28.4%, which meant the average entry salary level of New Economy was higher than national average entry wage level. The entry level salary premium of the New Economy was 4.3% as compared to economy-wide counterparts, increasing from 4.0% in May (Chart 6). In the recent half year, the average salary premium of the New Economy was lower than the first half of 2017 generally, while we saw an uptrend in recent two months.

Decomposition of New Established Enterprises
We use newly-established enterprises data to monitor new enterprises in sub-sectors (Chart 7).
Sub-sectors which were continuously ranking up in last two years include the following: Construction Engineering (No.25 in 2016, rising to No.22 and No.12 in 2017 and 2018, 0.03% decrease and 0.36% increase in proportion in 2017 and 2018 respectively); Building Materials (No. 17 in 2016, rising to No. 16 and No. 14 in 2017 and 2018, 0.04% decrease and 0.18% increase in proportion 2017 and 2018 respectively).
Sub-sectors which were continuously ranking down in two last years include the following: Communication (No. 16 in 2016, dropping to No. 17 and No. 21 in 2017 and 2018, 0.06% decrease and 0.05% increase in proportion 2017 and 2018 respectively); E-commerce (No. 9 in 2016, dropping to No. 14 and No. 18 in 2017 and 2018, 0.34% decrease and 0.01% increase in proportion 2017 and 2018 respectively).
Sub-sectors with fluctuating ranks in last two years include the following: Information (No.15 in 2016, rose to No.11 in 2017 and dropped to No.13 in 2018); Education (No.18 in 2016, rose to No.15 in 2017 and dropped to No.17 in 2018); Logistics (No.21 in 2016, rose to No.19 in 2017 and dropped to No.25 in 2018); Real Estate (No.24 in 2016, rose to No.18 in 2017 and dropped to No.23 in 2018); Agriculture (No.13 in 2016, dropped to No.24 in 2017 and rose to No.22 in 2018); Service (No.4 in 2016, dropped to No.7 in 2017 and rose to No.4 in 2018); Labor (No.22 in 2016, dropped to No.25 in 2017 and rose to No.19 in 2018); Business (No.2 in 2016, dropped to No.4 in 2017 and rose to No.2 in 2018). Other subsectors with fluctuating ranks were IT, Construction, Trade, Consulting, Engineering, Catering and Media.
Industrial Value-Added Based on Employment Data
Last month, we explored China’s industrial value-added using the employment of low-skilled general workers and operators and had good fitting results. This indicates strong correlations of official industrial production and online recruiting data.
This month, we focused on patterns in different provincial areas. We compared the year-on-year growth rate of the employment in various regions in Q2 with the year-on-year growth rate of industrial value-added in May, and found significant positive correlation between the two indicators (Chart 8). In Chart 8, it can be seen that most regions were located in the first and third quadrants, indicating positive correlation similar to national data.
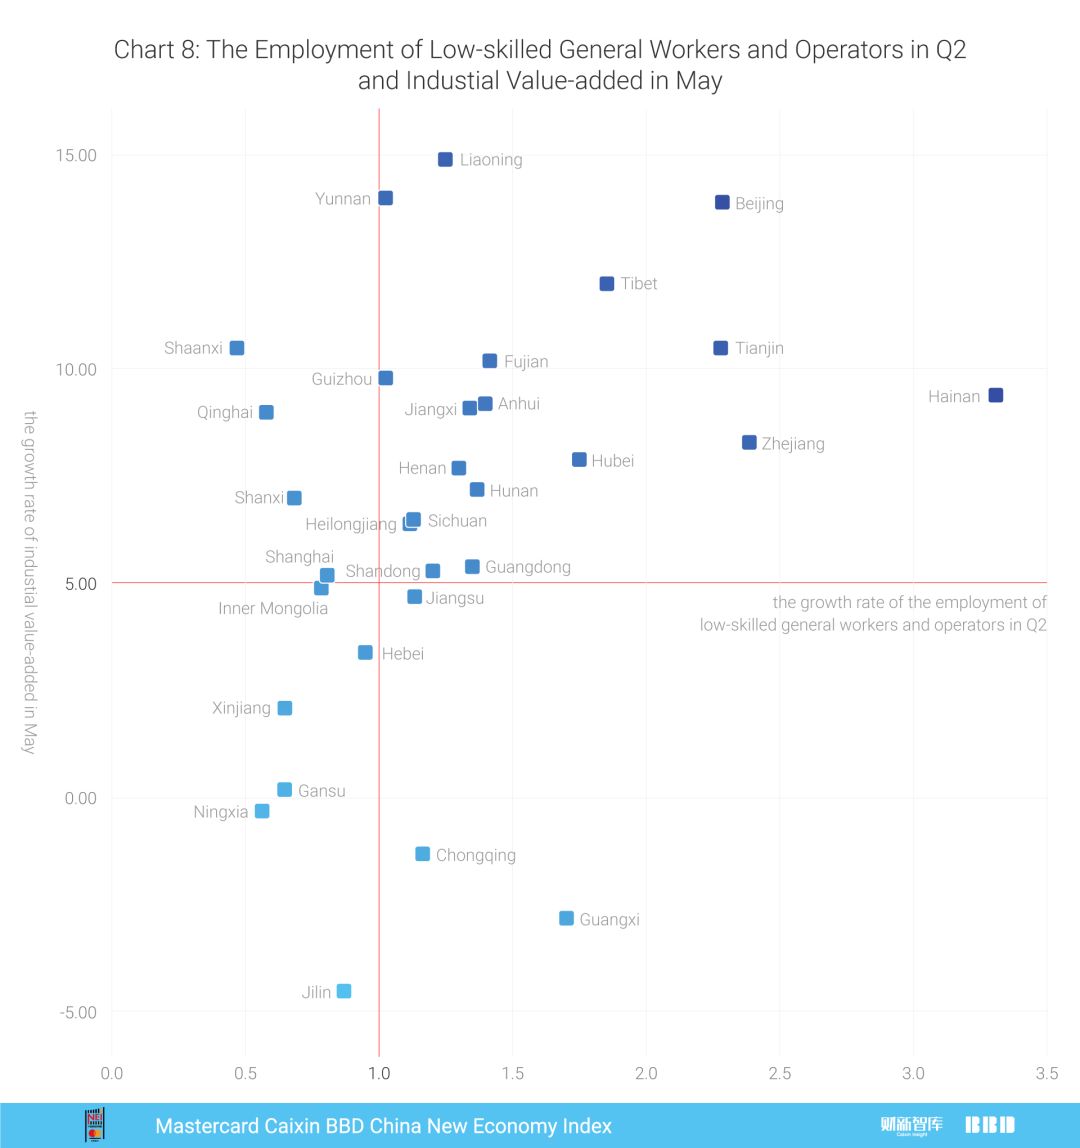
However, some exceptions were observed in the second and fourth quadrants. In particular, the provinces in the second quadrants showed a much higher growth rate of industrial value-added, including Shaanxi, Qinghai and Shanxi. And the provinces in the fourth quadrants showed a much higher growth rate of employment, including Chongqing and Guangxi. We need to keep close eyes in the future on the regions with divergence between statistical data and big data.
Change of Passenger Inflow Based on Major Airports
We are keeping tracking the change of daily passengers flow at major airports in the past two years (Chart 9). In terms of net inflow, we found differences between the first-tier cities’ airports and the second- and third-tier cities’ ones. As we know, the increase of passenger inflow at the first-tier cities’ airports was much lower than that at the second- and third-tiers cities’ airports in recent years. The passenger inflow at the first-tier cities’ airports showed a flat trend, with moderate increase compared to April 2016, which included airports in Beijing, Shanghai and Guangzhou. However, the passenger inflow at the second- and third-tier cities’ airports fluctuated with over 100% increase. The boost in Shijiazhuang was so remarkable that from April 2016 to October 2017 passenger inflows at Shijiazhuang airport increased by 6.2 times.
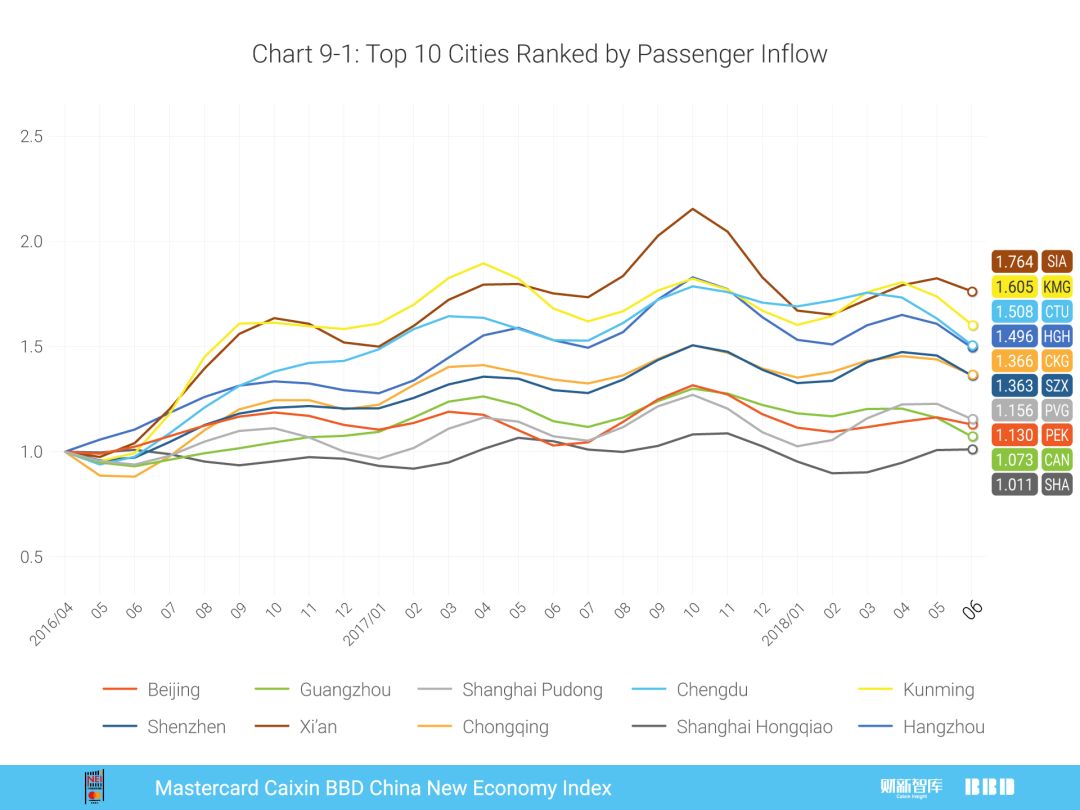
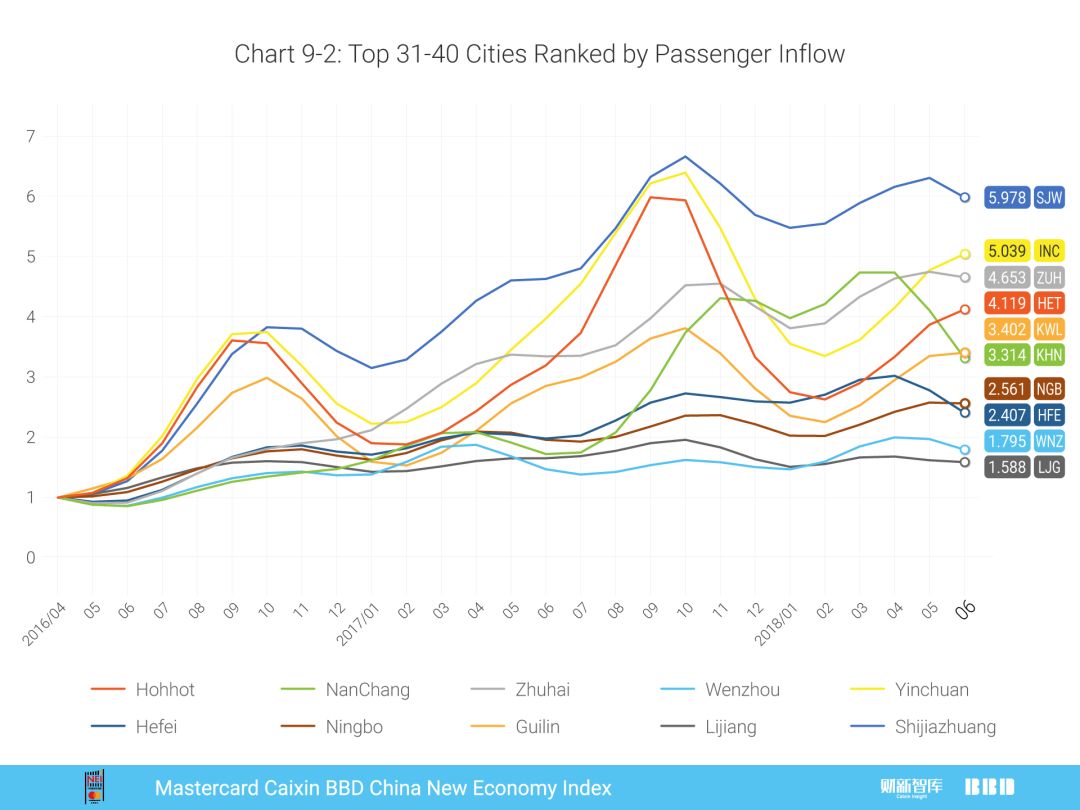
By comparing the passenger inflow of two groups, we found an inverted U-shaped trend of passengers inflow peaking around October 2017, which was similar to that of industrial value-added and fixed asset investment. In the light of this, the recovery of China’ s macroeconomy is yet to start.
City Rankings of the New Economy
Based on overall New Economy rankings, the top twenty cities were shown in Chart 10. The top five cities were Beijing, Shanghai, Guangzhou, Shenzhen and Nanjing. Rankings are based on a weighted average of the percentile rank of indicators for the city in the past 6 months.
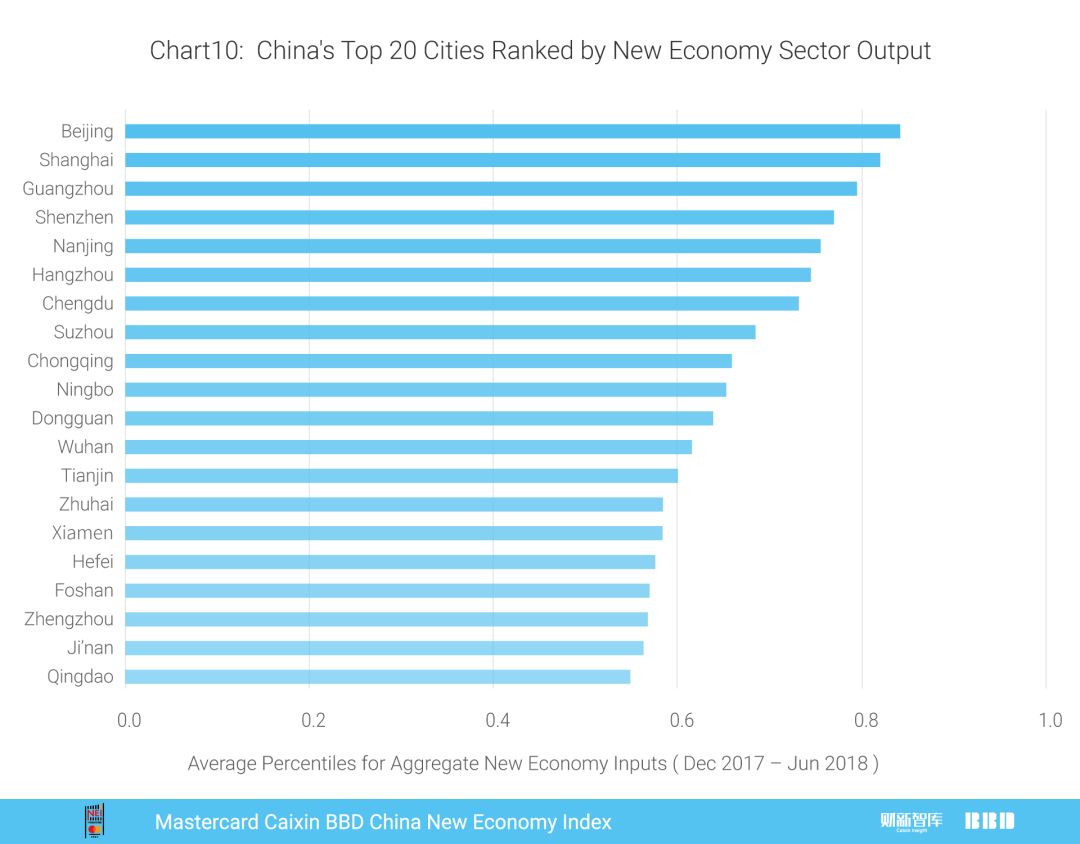
Chart 11 showed the average NEI city rankings between December 2017 and June 2018. The top five cities were Guangzhou, Beijing, Shanghai, Hangzhou and Nanjing.
For further information please contact:
Mastercard