天子呼来不上船,
自称臣是菜鸟团。
在这里,和国际同行一起学习单细胞数据分析。
忘不了你对着屏幕微笑的样子,于是,这里应该有更精彩的故事。我们将见证单细胞技术
飞入寻常百姓家
的过程,这一路上我想一定有许多的细节,就像某个default参数,被看见的时候也有一席暖意。为了记录更多细节,在这里划出一块宝地,聊聊单细胞数据分析包Seurat,就在前几天它升级到了4.0版本。学习一个工具,系统了解这个领域,在这里有:
-
翻译学习法
-
认知学习法
-
通勤学习法
-
追踪工具动态
-
相信我,你并不孤独
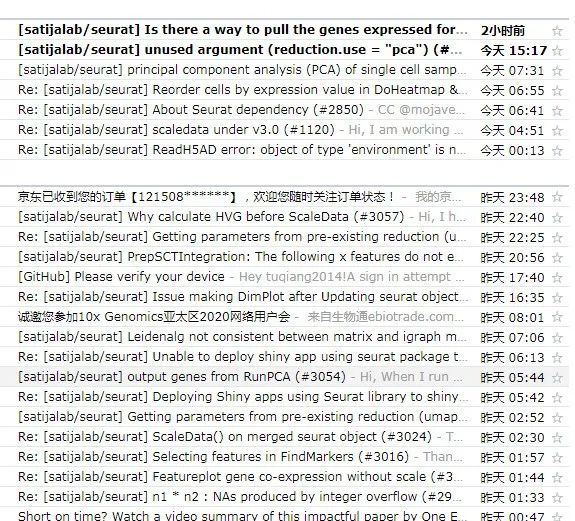
因为国内的单细胞数据分析人员越来越多,而Seurat为单细胞数据分析提供了一个很好的思考框架,当然Seurat发表的文章有很多。大家在应用这个单细胞数据分析工具的时候不免会遇到这样或那样的问题,这虽然是让人苦恼的,但是一位伟人说过:好的问题要比好的答案价值百倍。于是,我在Seurat的github上watch了所有的问题,所以我的个人邮箱是这样的:

所以看看大家都踩了Seurat的哪些坑,Seurat社区成员又是如何回复的,不能不说是一件有意思的事儿。何况还能学习一下英语啦_.
计划是每期精选不多于10条的Issues,在翻译和复现这些issue的时候也会掺杂一些自己对Seurat的学习心得,以促进Seurat学者了解这个项目。
目前github上面大部分的交流用的还是英语,我们为什么不用汉语在上面交流呢?那样就达不到学习英语的目的了吧。凡事善始者实繁,克终者盖寡。Seurat Weekly能做几期呢?我们不能承诺,毕竟这是一项无人资助的事业,看缘分呢。
最为NO.0,今天主要探索一下选题与排版的一般规则。
选题的第一个规则就是某个话题出现的频率,我们相信一个有很多人愿意讨论的话题更大概率是一个好问题。其次是主编本人觉得有意思的问题。
至于排版,我们按照一般的FAQ的形式给出,问题部分我们给出原文描述,答案就是主编在看过别人的回答之后,夹杂着个人观点的评论。
每个问题,我们也给出在github的链接,方便读者朋友就原问题进行解答。
下面走几个例子:
Getting parameters from pre-existing reduction (umap) (#3053)
github地址:https://github.com/satijalab/seurat/issues/3053
这位oh111 的意思应该是手里有了Seurat对象,想知道这个对象之前的作者是如何操作的。其实Seurat是给了每个操作过程的参数记录:
就拿我们seurat自带的数据集来看吧:
Seurat::pbmc_small@commands
这返回的是一个list,他说想看PCA的参数,其实这样就可以了:
Seurat::pbmc_small@commands$RunPCA.RNA
Command: RunPCA(object = pbmc_small, features = VariableFeatures(object = pbmc_small),     verbose = FALSE)
Time: 2018-08-28 04:34:56
assay : RNA
features : PPBP IGLL5 VDAC3 CD1C AKR1C3 PF4 MYL9 GNLY TREML1 CA2 SDPR PGRMC1 S100A8 TUBB1 HLA-DQA1 PARVB RUFY1 HLA-DPB1 RP11-290F20.3 S100A9
compute.dims : 20
rev.pca : FALSE
weight.by.var : TRUE
verbose : FALSE
print.dims : 1 2 3 4 5
features.print : 30
reduction.name : pca
reduction.key : PC
seed.use : 42
另一个
Reorder cells by expression value in DoHeatmap & Dendogram (#3036)
github 地址:https://github.com/satijalab/seurat/issues/3036
这是一个可视化细节的问题,有时候我们用默认参数出来的图并不能直接达到发表的水平,或者自己有些小心思想改一下这个图,最常见的就是该标签的顺序。其实我们知道这个一般是通过因子变量的levels来控制的。
有位仁兄给出了这个链接:https://stackoverflow.com/questions/52136211/how-to-reorder-cells-in-doheatmap-plot-in-seurat-ggplot2
那么我们来看一下Seurat的绘图是如何实现的,看DoHeatmapd的源代码:
 DoHeatmap
function (object, features = NULL, cells = NULL, group.by = "ident",
    group.bar = TRUE, group.colors = NULL, disp.min = -2.5, disp.max = NULL,
    slot = "scale.data", assay = NULL, label = TRUE, size = 5.5,
    hjust = 0, angle = 45, raster = TRUE, draw.lines = TRUE,
    lines.width = NULL, group.bar.height = 0.02, combine = TRUE)
{
    cells     if (is.numeric(x = cells)) {
        cells     }
    assay     DefaultAssay(object = object)     features     features     disp.max         yes = 2.5, no = 6)
    possible.features         slot = slot))
    if (any(!features %in% possible.features)) {
        bad.features         features         if (length(x = features) == 0) {
            stop("No requested features found in the ", slot,
                " slot for the ", assay, " assay.")
        }
        warning("The following features were omitted as they were not found in the ",
            slot, " slot for the ", assay, " assay: ", paste(bad.features,
                collapse = ", "))
    }
    data         slot = slot)[features, cells, drop = FALSE])))
    object         save.name = "ident"))
    group.by     groups.use     plots     for (i in 1:ncol(x = groups.use)) {
        data.group         group.use         if (!is.factor(x = group.use)) {
            group.use         }
        names(x = group.use)         if (draw.lines) {
            lines.width                 0.0025)
            placeholder.cells                 lines.width), FUN = function(x) {
                return(RandomName(length = 20))
            })
            placeholder.groups                 times = lines.width)
            group.levels             names(x = placeholder.groups)             group.use             names(x = group.use)             group.use                 levels = group.levels)
            na.data.group                 ncol = ncol(x = data.group), dimnames = list(placeholder.cells,
                  colnames(x = data.group)))
            data.group         }
        lgroup         plot             disp.min = disp.min, disp.max = disp.max, feature.order = features,
            cell.order = names(x = sort(x = group.use)), group.by = group.use)
        if (group.bar) {
            default.colors             cols                 default.colors
            if (any(is.na(x = cols))) {
                cols[is.na(x = cols)]                 cols                 col.dups                   start = 1, stop = 7)))))
                through                 while (length(x = col.dups) > 0) {
                  pal.max                   cols.extra                     1):pal.max]
                  cols[col.dups]                   col.dups                     start = 1, stop = 7)))))
                }
            }
            group.use2             if (draw.lines) {
                na.group                 levels(x = group.use2)                   na.group)
                group.use2[placeholder.cells]                 cols             }
            pbuild             names(x = cols)             y.range             y.pos                 y.range * 0.015
            y.max             plot                 xmin = -Inf, xmax = Inf, ymin = y.pos, ymax = y.max) +
                coord_cartesian(ylim = c(0, y.max), clip = "off") +
                scale_color_manual(values = cols)
            if (label) {
                x.max                 x.divs                 x                   x = x.divs)
                label.x.pos                   FUN = median) * x.max
                label.x.pos                   label.x.pos)
                plot                   aes_string(label = "group", x = "label.x.pos"),
                  y = y.max + y.max * 0.03 * 0.5, angle = angle,
                  hjust = hjust, size = size)
                plot                   y.max + y.max * 0.002 * max(nchar(x = levels(x = group.use))) *
                    size), clip = "off"))
            }
        }
        plot         plots[[i]]     }
    if (combine) {
        plots     }
    return(plots)
}
我们发现Seurat的图是用ggplot2实现的,这样我们就可以基于函数的返回对象来用自己的ggplot功底修复了:


