这里的
Data
不仅仅是画地图上行政区域的数据,而且包括要在地图上呈现的数据。
大多数图层添加函数都有
data
参数,通常使用
%>%
管道符逐渐传递
data
参数。
leaflet()
通常支持下列几种形式的数据。
对于经度和纬度组成矩阵或数据框类型数据,在调动data添加图层时,会根据变量名进行猜测匹配:
-
若变量名称为
lat
,或
latitude
等,则猜测为纬度,猜测时,
不区分大小写
。
-
若变量名称为
lng
,
long
或
longitude
等,则猜测为经度,猜测时,不区分大小写。
也可以
手动指定
经度和纬度变量,使用
~
语法。
在参数传递过程中,默认后面的
data
参数
覆盖
前面
data
参数。
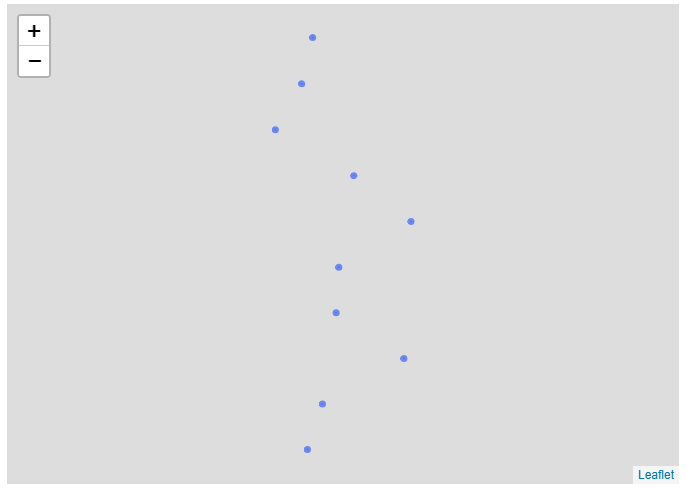
data中经纬度的指定/猜测/覆盖
 1library(leaflet)
 2
 3# 自动猜测匹配
 4set.seed(123)
 5df 1:10, Long = rnorm(10))
 6leaflet(df) %>% addCircles()
 7
 8# 手动指定经度和纬度变量,结果一样 leaflet(df) %>% addCircles(lng = ~Long,
 9# lat = ~Lat)
10
11# 在add_xxx()函数中重新指定参数进行覆盖,结果一样 leaflet() %>%
12# addCircles(data = df) leaflet() %>% addCircles(data = df, lat = ~Lat, lng
13# = ~Long)
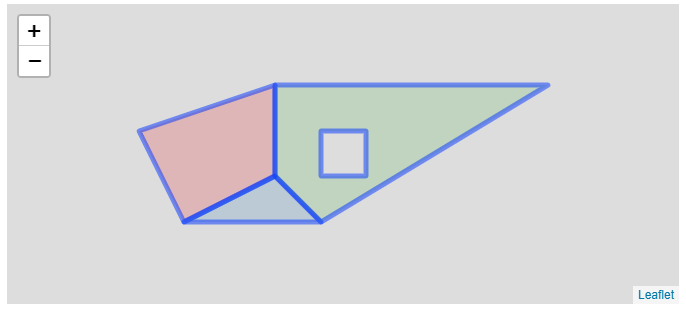
sp
对象的data
1library(leaflet)
2library(sp)
3library(RColorBrewer)
4
5Sr1 2, 4, 4, 1, 2), c(2, 3, 5, 4, 2)))
6Sr2 5, 4, 2, 5), c(2, 3, 2, 2)))
7Sr3 4, 4, 5, 10, 4), c(5, 3, 2, 5, 5)))
8Sr4 5, 6, 6, 5, 5), c(4, 4, 3, 3
, 4)), hole = TRUE)
9
10
11Srs1 list(Sr1), "s1")
12Srs2 list(Sr2), "s2")
13Srs3 list(Sr4, Sr3), "s3/4")
14
15
16SpP list(Srs1, Srs2, Srs3), 1:3)
17
18leaflet(height = "300px") %>% addPolygons(data = SpP, fillColor = brewer.pal(3,
19 name = "Set1"))
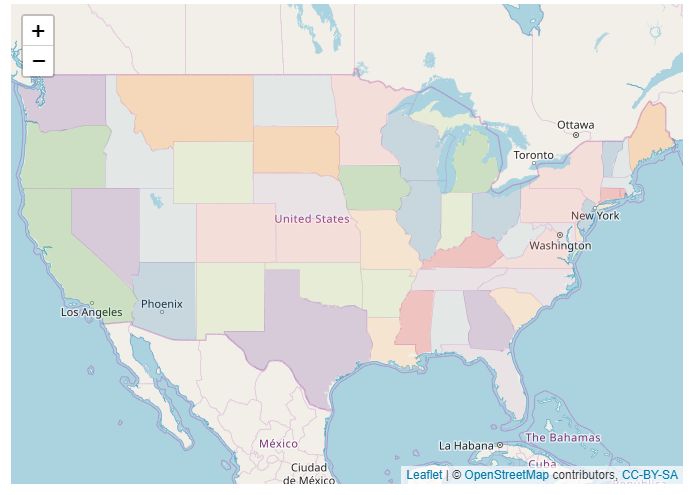
从
maps
包中获取data
1library(leaflet)
2library(maps)
3library(RColorBrewer)
4
5mapStates "state", fill = TRUE, plot = FALSE)
6leaflet(data = mapStates) %>% addTiles() %>% addPolygons(fillColor = brewer.pal(10,
7    name = "Paired"), stroke = FALSE)
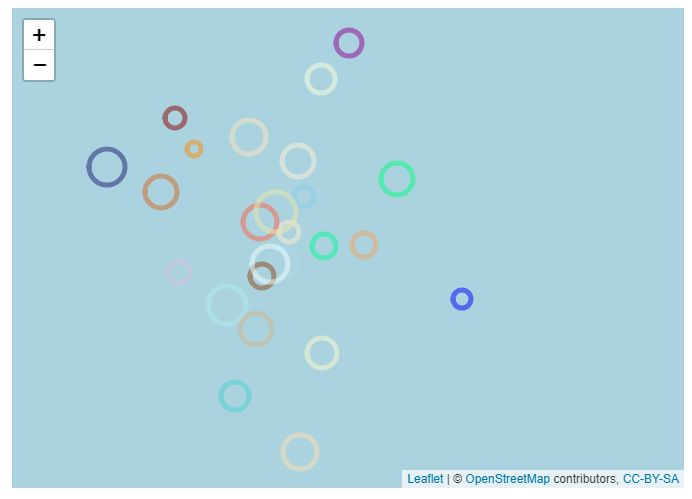
其它参数
其它绘图参数支持R自带的数据类型,如:向量,颜色向量,数据框,同样支持用
~
指定。
1library(leaflet)
2
3
4m % addTiles()
5df 100), lng = rnorm(100), size = runif(100, 5, 20),
6 color = sample(colors(), 100))
7
8m % addTiles()
9
10m %>% addCircleMarkers(radius = ~size, color = ~color, fill = FALSE)
11
12m %>% addCircleMarkers(radius = runif(100, 4, 10), color = c("red"))

leaflet
支持Tilemap类型的底图,
leaflet
支持多种免费第三方providers的tiles, 包括
Stamen
,
Esri
,
OpenWeatherMap
等,
用
names(providers)
可以查看所有的providers。
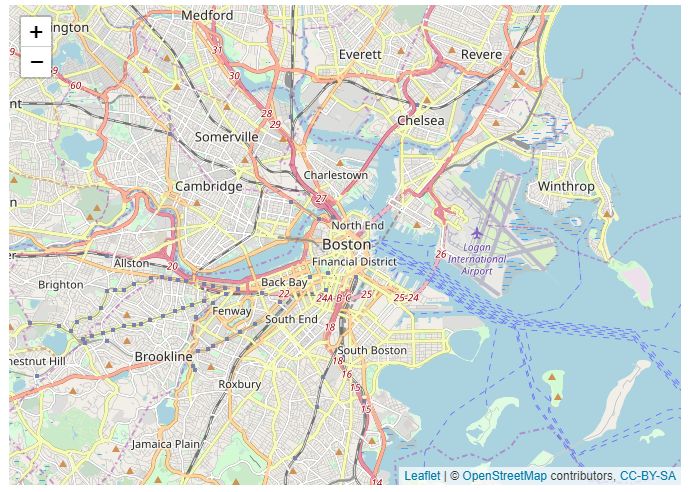
使用
addTiles()
函数添加tiles并使用默认参数,默认即是OpenStreetMap,即
街区Tiles
。
1library(leaflet)
2
3m % setView(lng = -71.0589, lat = 42.3601, zoom = 12)
4m %>% addTiles()
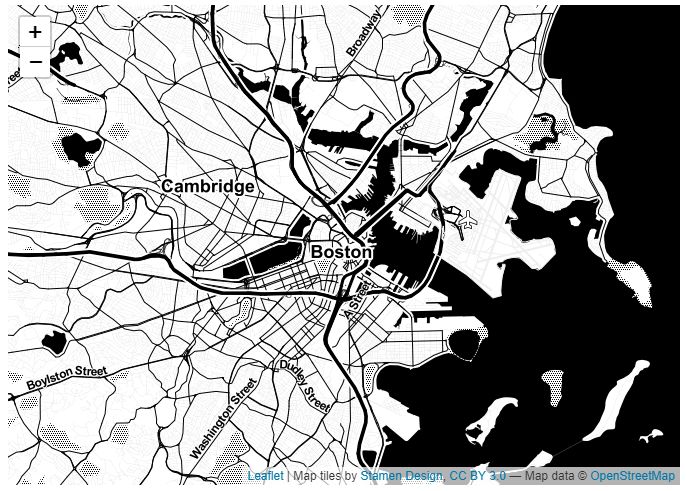
调用
addProviderTiles()
函数,在参数
providers$
后面加tiles供应商的名字就行了。 需要注意:部分第三方tiles需要注册。
通过
options
参数调用
providerTileOptions()
函数可以规避部分tiles的注册。
如果有定制的tiles模板的URL链接,可以在
addTiles()
函数中调用。
1library(leaflet)
2
3m % setView(lng = -71.0589, lat = 42.3601, zoom = 12)
4
5
6m %>% addProviderTiles(providers$Stamen.Toner)
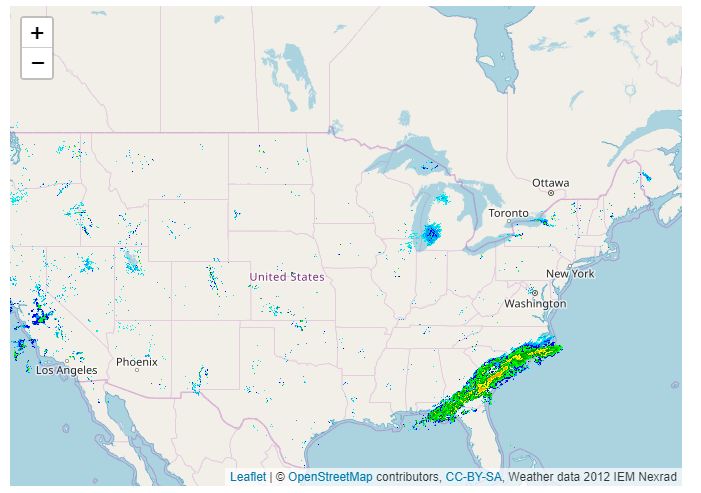
通过调用函数
addWMSTiles()
可以添加WMS(Web Map Service)的tiles。
Web地图服务(WMS)是一种标准协议,描述如何通过Internet提供任何地理配准的地图图像,
这通常由使用来自地理信息系统数据库的数据的地图服务器生成。
协议标准由Open Geospatial Consortium(OGC)开发,
并于1999年首次发布.WMS提供了一种使用HTTP接口请求地理注册地图图像的简单方法。
WMS供应商
(
https://en.wikipedia.org/wiki/Web_Map_Service
)
下图是调用WMS的tiles,显示降雨量的图
数据来源
(
http://mesonet.agron.iastate.edu/
)。
1library(leaflet)
2
3leaflet() %>% addTiles() %>% setView(-93.65, 42.0285, zoom = 4) %>%
4addWMSTiles("http://mesonet.agron.iastate.edu/cgi-bin/wms/nexrad/n0r.cgi", layers = "nexrad-n0r-900913",
5 options = WMSTileOptions(format = "image/png", transparent = TRUE), attribution = "Weather data 2012 IEM Nexrad")
多个Tiles图层也可以叠加, 但是这种情况通常仅用于表层tiles是半透明的情况下,
或在
options
参数中手动指定不透明度
opacity
。
opacity
从0(完全透明)到1(完全不透明)。
1library(leaflet)
2
3m % setView(lng = -71.0589, lat = 42.3601, zoom = 12)
4
5m %>% addProviderTiles(providers$MtbMap) %>%
6 addProviderTiles(providers$Stamen.TonerLines,
7 options = providerTileOptions(opacity = 0.35)) %>%
8 addProviderTiles(providers$Stamen.TonerLabels)
使用图标用于标记地图上特殊的点。图标的位置通过经纬度指定。
leaflet
中,图标可以分为:icon,circle图标,clusters(簇),共3类。
Markers坐标获取途径:
-
SpatialPoints()/SpatialPointsDataFrame()
(
sf
包)
-
POINT
,
sfc_POINT
或
sf
对象(
sf
包), 只有x,y维度的数据才能被使用。
-
只有2列的矩阵(第1列为经度,第2列为纬度)
-
含经度列和纬度列的数据框,
同样默认猜测匹配,也可以手动指定,如:
addMarkers(lng = ~Longitude, lat = ~Latitude)
。
-
用1个数字向量指定
lng
或
lat
参数。
注意:不支持
sf
包中的
MULTIPOINT
对象。
icon图标的添加分为几类:
-
addMarkers()
函数,添加
leaflet
中内置一种icon。
-
makeIcon()
指定
addMarkers()
函数内的
icon
参数,
添加URL链接(包括file path)中的一种icon。
-
icons()
指定
addMarkers()
内的
icon
参数,同时添加几种icon。
-
iconList()
与
addMarkers()
函数联用,同时添加很多种icon。
-
addAwesomeMarkers()
函数,添加awesome icons。
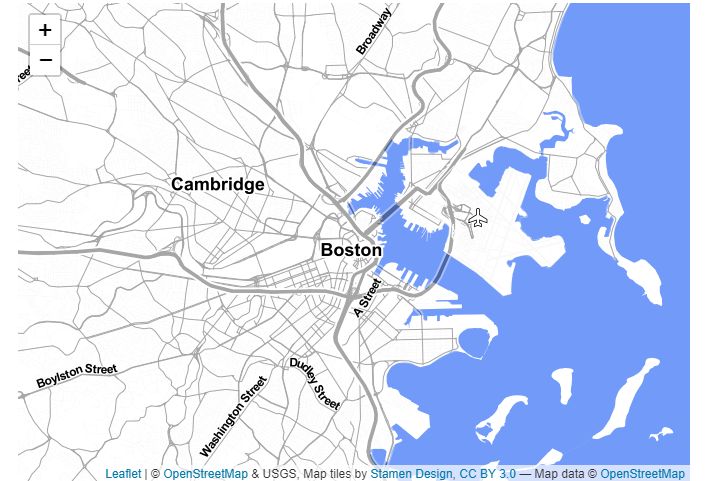
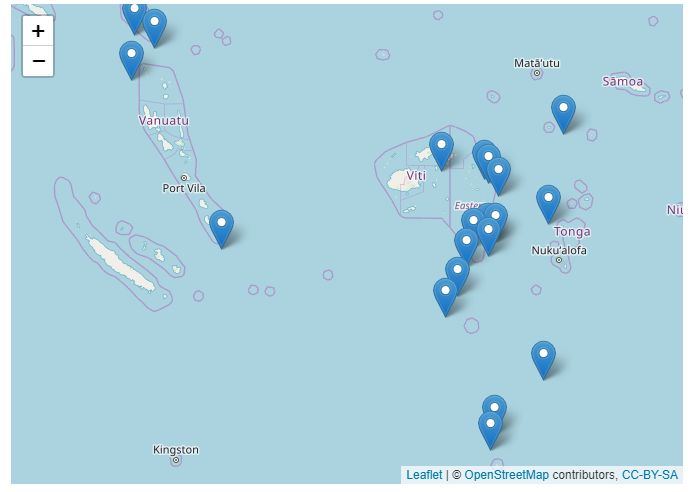
内置icon(
addMarkers()
)
默认Icon为雨滴状图标(dropped pin)。
与大多数图层绘制函数一样,
popup
参数可以用来指定一个message,当点击该Icon则显示该message;
label
参数可以用来指定一个文本标签,可以是浮动的或静止的。
1library(leaflet)
2data(quakes)
3
4# 索引quakes前20行数据进行显示。
5leaflet(data = quakes[1:20, ]) %>% addTiles() %>%
6# 增加图标图层,标签显示为quakes中的mag变量
7addMarkers(~long, ~lat, popup = ~as.character(mag), label = ~as.character(mag))
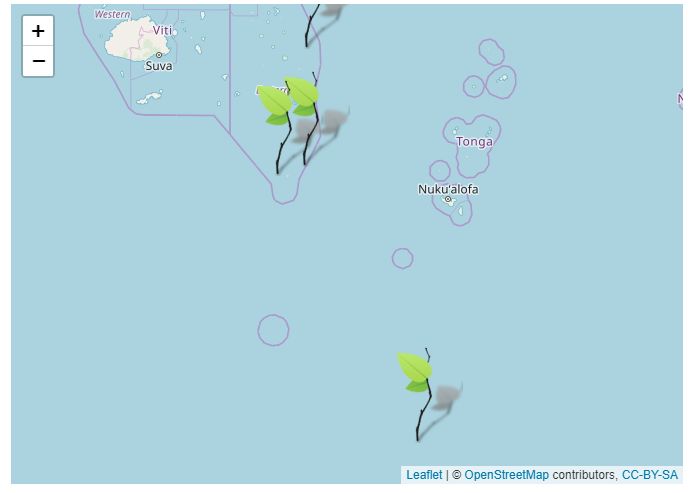
自定义icon(
makeIcon()
)
自定义Icon图标,可以通过URL链接或文件路径来指定。
对于单独一个Icon,若要映射到多个数据点,则可以使用
makeIcon()
函数制作一组Icon图标,
然后再调用
addMarkers()
函数增加Marker图层。
免费Icon下载
(
https://icons8.com/icons
)
 1library(leaflet)
 2data(quakes)
 3
 4# 制作一组Icon
 5greenLeafIcon <- makeIcon(
 6  iconUrl = "E:/R_input_output/images_input/leaf-green.png", # 使用文件路径指定
 7  iconWidth = 38, iconHeight = 95, # 设定当个Icon的相对长宽。
 8  iconAnchorX = 22, iconAnchorY = 94, # 定位点相对位置(在IconWidth和IconHeight内)
 9  shadowUrl = "E:/R_input_output/images_input/leaf-shadow.png", # 阴影Icon
10  shadowWidth = 50, shadowHeight = 64,
11  shadowAnchorX = 4, shadowAnchorY = 62
12)
13
14leaflet(data = quakes[1:4,]) %>% addTiles() %>%
15  addMarkers(~long, ~lat, icon = greenLeafIcon) # 增加Icon图层
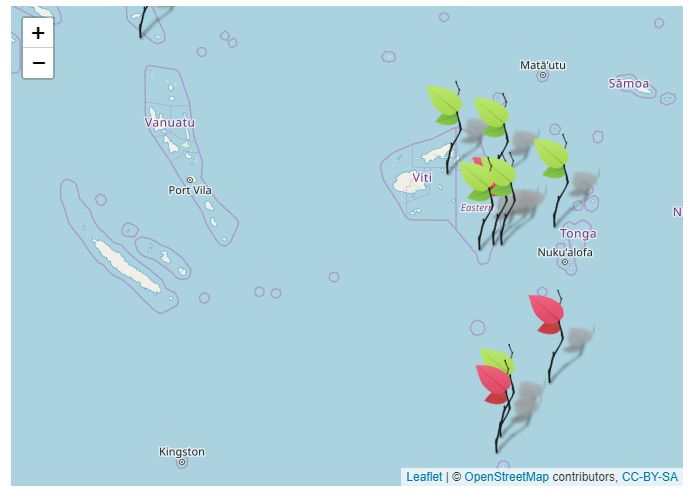
icons()
(多种icons)
若多个Icons图标尺寸等参数一致,仅仅URLs不一样,使用
icons()
制作Icon图标组合非常方便,
icons()
语法与
data.frame()
类似,参数都可以用向量指定,短的参数将会
循环补齐
。
 1library(leaflet)
 2data(quakes)
 3
 4quakes1 <- quakes[1:10,] # 索引前10行数据
 5
 6leafIcons <- icons(
 7  iconUrl = ifelse(quakes1$mag 4.6, # 若mag 4.6为真
 8    "E:/R_input_output/images_input/leaf-green.png", # test = TRUE
 9    "E:/R_input_output/images_input/leaf-red.png" # test = FALSE
10  ),
11  iconWidth = 38, iconHeight = 95, # length = 1, 循环补齐
12  iconAnchorX = 22, iconAnchorY = 94, # length = 1, 循环补齐
13  shadowUrl = "E:/R_input_output/images_input/leaf-shadow.png", # length = 1, 循环补齐
14  shadowWidth = 50, shadowHeight = 64, # length = 1, 循环补齐
15  shadowAnchorX = 4, shadowAnchorY = 62 # length = 1, 循环补齐
16)
17
18leaflet(data = quakes1) %>% addTiles() %>%
19  addMarkers(~long, ~lat, icon = leafIcons) # 传递制作的Icons参数
20
icon列表(
iconList()
)
若一些Icons的参数相差很大,此时使用
iconList()
函数更加方便,
相当于创建一个列表将
makeIcon()
创建icons包裹起来。然后整体传递给
addMarkers()
。
1library(leaflet)
2
3
4oceanIcons 5 ship = makeIcon(iconUrl = "E:/R_input_output/images_input/cargo-ship.png",
6 iconWidth = 30, iconHeight = 20),
7 pirate = makeIcon(iconUrl = "E:/R_input_output/images_input/pirates-caribbean.png",
8 iconWidth = 30, iconHeight = 30)
9)
10
11
12df 13 cbind(
14 (runif(20) - .5) * 10 - 90.620130,
15 (runif(20) - .5) * 3.8 + 25.638077
16 ),
17 data.frame(type = factor(
18 ifelse(runif(20) > 0.75, "pirate", "ship"),
19 c("ship", "pirate")

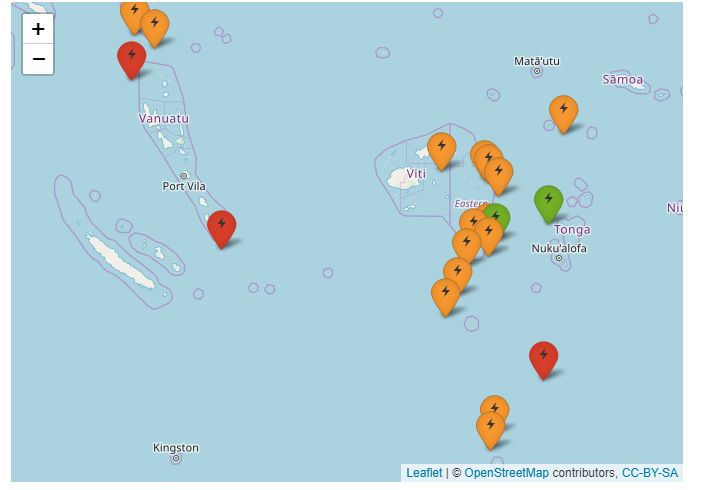
Awesome icons(
addAwesomeMarkers()
)
leaflet
中可以使用定制Icons的颜色,
使用
addAwesomeMarkers()
添加awesome icons, 用法与
addMarkers()
类似。
awesome icons库:
fontawesome,glyphicon,ionicons。
在
addAwesomeMarkers()
中可以用
library
参数指定awesome icons库。
默认为
library = "glyphico"
,
library = "fa"
表示fontawesome库,
library = "ion"
表示ioncons库,
与
icons()
和
iconList()
函数可以用于
addMarkers()
类似,
awesomeIcons()
和
awesomeIconList()
函数可以用于
addAwesomeMarkers()
以添加多个icons。
1library(leaflet)
2data(quakes)
3
4df.20 1:20,]
5
6
7getColor function(quakes) {
8 sapply(quakes$mag, function(mag) {
9 if(mag <= 4) {
10 "green"
11 } else if(mag <= 5) {
12 "orange"
13 } else {
14 "red"
15 } })
16}
17
18icons 19 icon = 'flash',
20 iconColor = 'black',
21 library = 'ion',
22 markerColor = getColor(df.20)
23)
24
25leaflet(df.20) %>% addTiles() %>%
26 addAwesomeMarkers(~long, ~lat, icon=icons, label=~as.character(mag))