(点击上方蓝字,快速关注我们)
编译:伯乐在线 - mathshelly
如有好文章投稿,请点击 → 这里了解详情
这篇文章是以Bremen大学机器学习课程的教程为基础的。本文总结了使用机器学习解决新问题的一些建议。包括:
可视化数据的方法
选择一个适合当前问题的机器学习方法
鉴别和解决过拟合和欠拟合问题
处理大数据库问题(注意:不是非常小的)
不同损失函数的利弊
本文以Andrew Ng的《应用机器学习的建议 | Advice for applying Machine Learning》为基础。这个笔记的目的是用一个互动的方法解释这些观点。有些建议是可以讨论的。它们仅是建议,不是严格的规则。
In [1]:
import time
import numpy as np
np.random.seed(0)
In [2]:
import matplotlib.pyplot as plt
import seaborn as sns
%matplotlib inline
In [3] :
#Modified from http://scikit-learn.org/stable/auto_examples/plot_learning_curve.html
From sklearn.learning_curve import learning_curve
Def plot_learning_curve(estimator, title, x, ylim=None, cv=None, train_sizes=np.linspace(.1,1.0,5)):
Generate a simple plot of the test and train learning curve.
Parameters
----------------
estimator:object type that implements the “fit” and “predict” methods
An object of that type which is cloned for each validation.
title : string
Title for the chart.
x : array-like, shape(n_samples, n_features)
Training vector, where n_samples is the number of samples and n_features is the number of features
y : array-like, shape (n_samples) or (n_samples, n_features)
Target relative to X for classification or regression;
None for unsupervised learning.
ylim : tuple, shape(ymin, ymax), optional
Defines minimum and maximum yvalues plotted.
cv : integer, cross-validation generator, optional
If an integer is passed, it is the number of folds (defaults to 3).
Specific cross-validation objects can be passed, see sklearn.cross_validation module for the list of possible objects
‘’’’’’
plt.figure()
train_sizes, train_scores, test_scores = learning_curve(estimator, X, y, cv=5, n_jobs=1, train_sizes = train_sizes)
train_scores_mean = np.mean(train_scores, axis = 1)
train_scores_std = np.std(train_scores, axis = 1)
test_scores_mean = np.mean(test_scores, axis = 1)
test_scores_std = np.std(test_scores, axis = 1)
plt.fill_between(train_sizes, train_scores_mean – train_scores_std, train_scores_mean + train_scores_std, alpha = 0.1, color = “r”)
plt.fill_between(train_sizes, test_scores_mean – test_scores_std, test_scores_mean + test_scores_std, alpha = 0.1, color = “g”)
plt.plot(train_szies, train_scores_mean, ‘o-’, color = “r”, label = “Training score”)
plt.plot(train_szies, test_scores_mean, ‘o-’, color = “g”, label = “Cross-validation score”)
plt.xlabel(“Training examples”)
plt.ylabel(“Score”)
plt.legend(loc=”best”)
plt.grid(“on”)
if ylim:
plt.ylim(ylim)
plt.title(title)
数据集
我们使用sklearn的make_classification函数来生成一些简单的玩具数据:
In [4] :
from sklearn.datasets import make_classification
X, y = make_classification(1000, n_features=20, n_informative=2,
n_redundant=2, n_classes=2, random_state=0)
from pandas import DataFrame
df = DataFrame(np.hstack((X, y[:, None])),
columns = range(20) + ["class"])
注意到我们为二分类生成了一个数据集,这个数据集包括1000个数据点,每个特征20维。我们已经使用pandas的DataFrame类把数据和类别封装到一个共同的数据结构中。我们来看一看前5个数据点:
In [5]:
df[:5]
Out[5]:
0 1 2 3 4 5 6 7 8 9 ... 11 12 13 14 15 16 17 18 19 class
0 -1.063780 0.676409 1.069356 -0.217580 0.460215 -0.399167 -0.079188 1.209385 -0.785315 -0.172186 ... -0.993119 0.306935 0.064058 -1.054233 -0.527496 -0.074183 -0.355628 1.057214 -0.902592 0
1 0.070848 -1.695281 2.449449 -0.530494 -0.932962 2.865204 2.435729 -1.618500 1.300717 0.348402 ... 0.225324 0.605563 -0.192101 -0.068027 0.971681 -1.792048 0.017083 -0.375669 -0.623236 1
2 0.940284 -0.492146 0.677956 -0.227754 1.401753 1.231653 -0.777464 0.015616 1.331713 1.084773 ... -0.050120 0.948386 -0.173428 -0.477672 0.760896 1.001158 -0.069464 1.359046 -1.189590 1
3 -0.299517 0.759890 0.182803 -1.550233 0.338218 0.363241 -2.100525 -0.438068 -0.166393 -0.340835 ... 1.178724 2.831480 0.142414 -0.202819 2.405715 0.313305 0.404356 -0.287546 -2.847803 1
4 -2.630627 0.231034 0.042463 0.478851 1.546742 1.637956 -1.532072 -0.734445 0.465855 0.473836 ... -1.061194 -0.888880 1.238409 -0.572829 -1.275339 1.003007 -0.477128 0.098536 0.527804 0
通过直接查看原始特征值,我们很难获得该问题的任何线索,即使在这个低维的例子中。因此,有很多的提供数据的更容易视图的方法;其中的小部分将在接下来的部分中讨论。
可视化
当你接到一个新的问题,第一步几乎都是可视化,也就是说,观察你的数据。
Seaborn是一个不错的统计数据可视化包。我们使用它的一些函数来探索数据。
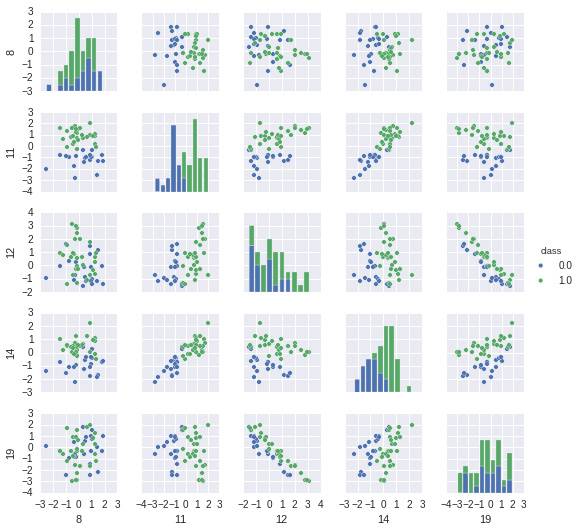
第一步是使用pairplot生成散点图和直方图。两种颜色对应了两个类别,我们使用了特征的一个子集、仅仅使用前50个数据点来简化问题。
In [6] :
_ = sns.pairplot(df[:50], vars=[8, 11, 12, 14, 19], hue="class", size=1.5)

基于该直方图,我们可以看到一些特征比其他特征对分类更有用。特别地,特征11和14看起来有丰富的信息量。这两个特征的散点图显示类别在二维空间中几乎是线性可分的。要更加注意的是,特征12和19是高度负相关的。我们可以通过使用corrplot更系统地探索相关性:
In [7] :
plt.figure(figsize=(12, 10))
_ = sns.corrplot(df, annot=False)

我们可以发现我们之前的观察结果在这里得到了确认:特征11和14与类强相关(他们有丰富的信息量)。更进一步,特征12和特征19强负相关,特征19和特征14强相关。因此,有一些特征是冗余的。这对于有些分类器可能会出现问题,比如,朴素贝叶斯,它假设所有的特征都是独立的。剩下的特征大部分都是噪声,他们既不相互关联,也不和类别相关。
注意到如果特征维数较大、数据点较少的时候,数据可视化会变得更有挑战性。我们在后面会给出一个高维数据可视化的例子。
方法的选择
一旦我们已经使用可视化方法对数据进行了探索,我们就可以开始应用机器学习了。机器学习方法数量众多,通常很难决定先尝试哪种方法。这个简单的备忘单(归功于Andreas Müller和sklearn团队)可以帮助你为你的问题选择一个合适的机器学习方法(供选择的备忘录见
http://dlib.net/ml_guide.svg)
In [8] :
from IPython.display import Image
Image(filename='ml_map.png', width=800, height=600)
Out[8] :

我们有了1000个样本,要预测一个类别,并且有了标签,那么备忘单推荐我们首先使用LinearSVC(LinearSVC代表线性核的支持向量分类,并且对于这类特殊问题使用一个有效的算法)。所有我们做了个试验。LinearSVC需要选择正则化;我们使用标准L2范数惩罚和C=10.我们分别画出训练分数和验证分数的学习曲线(这个例子中分数代表准确率):
In [9] :
from sklearn.svm import LinearSVC
plot_learning_curve(LinearSVC(C=10.0), "LinearSVC(C=10.0)",
X, y, ylim=(0.8, 1.01),
train_sizes=np.linspace(.05, 0.2, 5))

我们可以注意到训练数据和交叉验证数据的错误率有很大的差距。这意味什么?我们可能过度拟合训练数据了!
解决过拟合
有很多方法来减少过拟合:
(获得更多的数据是机器学习从业者的共同愿望)
In [10] :
plot_learning_curve(LinearSVC(C=10.0), "LinearSVC(C=10.0)",
X, y, ylim=(0.8, 1.1),
train_sizes=np.linspace(.1, 1.0, 5))

可以看到当训练数据增加时,验证分数越来越大,差距越来越小;因此现在不再过拟合了。有很多获得更多数据的方法,比如(a)可以尽力投资收集更多数据,(b)基于现有数据创造一些人为的数据(比如图像旋转,平移,扭曲),或者(c)加入人工噪声。
如果以上的这些方法都不可行,就不可能获得更多的数据,我们或者可以
(从我们可视化中可以知道,特征11和14是信息量最大的)
In [11] :
plot_learning_curve(LinearSVC(C=10.0), "LinearSVC(C=10.0) Features: 11&14",
X[:, [11, 14]], y, ylim=(0.8, 1.0),
train_sizes=np.linspace(.05, 0.2, 5))

注意到,因为我们是手动的挑选特征,而且在比我们给分类器更多的数据上,这有一点作弊的意味。我们可以使用自动挑选特征:
In [12] :
from sklearn.pipeline import Pipeline
from sklearn.feature_selection import SelectKBest, f_classif
# SelectKBest(f_classif, k=2) will select the k=2 best features according to their Anova F-value
plot_learning_curve(Pipeline([("fs", SelectKBest(f_classif, k=2)), # select two features
("svc", LinearSVC(C=10.0))]),
"SelectKBest(f_classif, k=2) + LinearSVC(C=10.0)",
X, y, ylim=(0.8, 1.0),
train_sizes=np.linspace(.05, 0.2, 5))

这样做效果非常好。在这个toy数据集上,特征选择是简单的。应该注意到特征选择只是减少模型复杂度的一个特殊种类。其他的方法是:(a)减少线性回归多项式模型的次数,(b)减少人工神经网络节点的个数/层数,(c)增加RBF核的带宽等等。
仍然有一个问题:为什么分类器不能自动的识别有用的特征?首先让我们转向另一种选择,来减少过拟合:
(减少线性SVC的C的系数)
In [13] :
plot_learning_curve(LinearSVC(C=0.1), "LinearSVC(C=0.1)",
X, y, ylim=(0.8, 1.0),
train_sizes=np.linspace(.05, 0.2, 5))

这已经有一点点作用了。我们也可以使用基于交叉验证的网格搜索自动地挑选分类器的正则化:
In [14] :
from sklearn.grid_search import GridSearchCV
est = GridSearchCV(LinearSVC(),
param_grid={"C": [0.001, 0.01, 0.1, 1.0, 10.0]})
plot_learning_curve(est, "LinearSVC(C=AUTO)",
X, y, ylim=(0.8, 1.0),
train_sizes=np.linspace(.05, 0.2, 5))
print "Chosen parameter on 100 datapoints: %s" % est.fit(X[:100], y[:100]).best_params_
在100个数据点上选择参数:{‘C’: 0.01}

一般说来,特征选择似乎更好。分类器可以自动识别有用的特征吗?回想一下,LinearSVC还支持L1范数惩罚,这产生了一个稀疏的解决方案。稀疏解决方案对应一个隐式的特征选择。让我们来试试这个:
In [15] :
plot_learning_curve(LinearSVC(C=0.1, penalty='l1', dual=False),
"LinearSVC(C=0.1, penalty='l1')",
X, y, ylim=(0.8, 1.0),
train_sizes=np.linspace(.05, 0.2, 5))

这看起来也很好。让我们来探讨学到的系数:
In [16] :
est = LinearSVC(C=0.1, penalty='l1', dual=False)
est.fit(X[:150], y[:150]) # fit on 150 datapoints
print "Coefficients learned: %s" % est.coef_
print "Non-zero coefficients: %s" % np.nonzero(est.coef_)[1]
Coefficients learned: [[ 0. 0. 0. 0. 0. 0.01857999
0. 0. 0. 0.004135 0. 1.05241369
0.01971419 0. 0. 0. 0. -0.05665314
0.14106505 0. ]]
Non-zero coefficients: [ 5 9 11 12 17 18]
大部分系数是0(对应的特征被忽略),并且目前最大的权重在特征11上。
不同的数据集
我们生成另外一个二分类的数据集,并且再次应用LinearSVC。
In [17]:
from sklearn.datasets import make_circles
X, y = make_circles(n_samples=1000, random_state=2)
In [18]:
plot_learning_curve(LinearSVC(C=0.25), "LinearSVC(C=0.25)",
X, y, ylim=(0.5, 1.0),
train_sizes=np.linspace(.1, 1.0, 5))

啊,这非常糟糕,甚至训练误差都不如随机误差。这个可能的原因是什么?难道上面的所有方法(更多数据,特征选择,增加正则化)都不奏效了吗?
结果是:No。我们处在一个完全不同的情况:以前,训练分数一直接近完美,我们不得不解决过拟合。这次,训练误差也非常低。是欠拟合。让我们来看一看数据:
In [19] :
df = DataFrame(np.hstack((X, y[:, None])),
columns = range(2) + ["class"])
_ = sns.pairplot(df, vars=[0, 1], hue="class", size=3.5)

这些数据显然不是线性可分的;更多的数据或者更少的特征没有用了。我们的模型错了;因此欠拟合。
解决欠拟合
减少欠拟合的方法:
In [20] :
# add squared distance from origin as third feature
X_extra = np.hstack((X, X[:, [0]]**2 + X[:, [1]]**2))
plot_learning_curve(LinearSVC(C=0.25), "LinearSVC(C=0.25) + distance feature",
X_extra, y, ylim=(0.5, 1.0),
train_sizes=np.linspace(.1, 1.0, 5))

非常好!但是我们必须要花一些心思来想出这些特征。或许分类器可以自动的做到这些?这需要
(减少正则化或非线性核)
In [21] :
from sklearn.svm import SVC
# note: we use the original X without the extra feature
plot_learning_curve(SVC(C=2.5, kernel="rbf", gamma=1.0),
"SVC(C=2.5, kernel='rbf', gamma=1.0)",
X, y, ylim=(0.5, 1.0),
train_sizes=np.linspace(.1, 1.0, 5))

是的,这也可以达到满意的效果!
更大的数据集和更高维的特征空间
回到原始的数据集上,但是这次有更多的特征和样本,并且有5类。LinearSVC在这样大小的数据集上会有一点慢;备忘单上建议使用SGDClassifier。这个分类器学习到一个线性模型(就像LinearSVC或logistic回归),但是它在训练中使用随机梯度下降(就像反向传播的人工神经网络一样)。
SGDClassifier允许小批量扫描数据,这对于数据量太大不能放到内存中时有帮助。交叉验证和这项技术不兼容;使用逐步验证代替:这里,估计器总是在训练数据集的下一块上进行测试(在用它进行训练之前)。训练之后,会再次进行测试来检查它适应数据的能力。
In [22] :
X, y = make_classification(200000, n_features=200, n_informative=25,
n_redundant=0, n_classes=10, class_sep=2,
random_state=0)
In [23]:
from sklearn.linear_model import SGDClassifier
est = SGDClassifier(penalty="l2", alpha=0.001)
progressive_validation_score = []
train_score = []
for datapoint in range(0, 199000, 1000):
X_batch = X[datapoint:datapoint+1000]
y_batch = y[datapoint:datapoint+1000]
if datapoint > 0:
progressive_validation_score.append(est.score(X_batch, y_batch))
est.partial_fit(X_batch, y_batch, classes=range(10))
if datapoint > 0:
train_score.append(est.score(X_batch, y_batch))
plt.plot(train_score, label="train score")
plt.plot(progressive_validation_score, label="progressive validation score")
plt.xlabel("Mini-batch")
plt.ylabel("Score")
plt.legend(loc='best')
Out[23]:

这个图告诉我们,在50个mini-batches的数据之后,我们已经不能再提高验证数据了,因此可以停止训练了。由于训练分数不是很高,我们可能是欠拟合而不是过拟合。要是使用rbf核测试一下就更好了,但是SGDClassifier很不幸的不兼容核技巧。替代方法是可以使用一个多层的感知机,它也可以使用随机梯度下降进行训练,但是一个非线性模型,或者像备忘单建议的,使用核近似法。
现在在一个机器学习中使用的经典的解决光学字符识别的数据集上:
In [24]:
from sklearn.datasets import load_digits
digits = load_digits(n_class=6)
X = digits.data
y = digits.target
n_samples, n_features = X.shape
print "Dataset consist of %d samples with %d features each" % (n_samples, n_features)
# Plot images of the digits
n_img_per_row = 20
img = np.zeros((10 * n_img_per_row, 10 * n_img_per_row))
for i in range(n_img_per_row):
ix = 10 * i + 1
for j in range(n_img_per_row):
iy = 10 * j + 1
img[ix:ix + 8, iy:iy + 8] = X[i * n_img_per_row + j].reshape((8, 8))
plt.imshow(img, cmap=plt.cm.binary)
plt.xticks([])
plt.yticks([])
_ = plt.title('A selection from the 8*8=64-dimensional digits dataset')
由1083个样本组成的数据集,每个样本由64个特征组成

因此我们有1083个手写数字(0,1,2,3,4,5)样本,每一个样本由8*8的4bit像素(0,16)灰度图片组成。因此特征的维数适中(64);但是,这64维空间的可视化是非常重要的。我们来说明不同的减少维数(至二维)方法,基于http://scikit-learn.org/stable/auto_examples/manifold/plot_lle_digits.html#example-manifold-plot-lle-digits-py
In [25]:
# Helper function based on
# http://scikit-learn.org/stable/auto_examples/manifold/plot_lle_digits.html#example-manifold-plot-lle-digits-py
from matplotlib import offsetbox
def plot_embedding(X, title=None):
x_min, x_max = np.min(X, 0), np.max(X, 0)
X = (X - x_min) / (x_max - x_min)
plt.figure(figsize=(10, 10))
ax = plt.subplot(111)
for i in range(X.shape[0]):
plt.text(X[i, 0], X[i, 1], str(digits.target[i]),
color=plt.cm.Set1(y[i] / 10.),
fontdict={'weight': 'bold', 'size': 12})
if hasattr(offsetbox, 'AnnotationBbox'):
# only print thumbnails with matplotlib > 1.0
shown_images = np.array([[1., 1.]]) # just something big
for i in range(digits.data.shape[0]):
dist = np.sum((X[i] - shown_images) ** 2, 1)
if np.min(dist) < 4e-3:
# don't show points that are too close
continue
shown_images = np.r_[shown_images, [X[i]]]
imagebox = offsetbox.AnnotationBbox(
offsetbox.OffsetImage(digits.images[i], cmap=plt.cm.gray_r),
X[i])
ax.add_artist(imagebox)
plt.xticks([]), plt.yticks([])
if title is not None:
plt.title(title)
已经随机投影的二维数据的结果不是太差:
In [26]:
from sklearn import (manifold, decomposition, random_projection)
rp = random_projection.SparseRandomProjection(n_components=2, random_state=42)
stime = time.time()
X_projected = rp.fit_transform(X)
plot_embedding(X_projected, "Random Projection of the digits (time: %.3fs)" % (time.time() - stime))

然而,有一个很著名的方法一般来说应该适合,也就是PCA(使用TruncatedSVD来实现,不需要构建协方差矩阵):
In [27]:
X_pca = decomposition.TruncatedSVD(n_components=2).fit_transform(X)
stime = time.time()
plot_embedding(X_pca,
"Principal Components projection of the digits (time: %.3fs)" % (time.time() - stime))

PCA给出一个更好的结果,而且在这个数据集上甚至更快。通过允许64维输入空间到二维目标空间的非线性变换,我们可以得到更好的结果。这有很多种方法;我们这里只介绍一种方法:t-SNE。
In [28]:
tsne = manifold.TSNE(n_components=2, init='pca', random_state=0)
stime = time.time()
X_tsne = tsne.fit_transform(X)
plot_embedding(X_tsne,
"t-SNE embedding of the digits (time: %.3fs)" % (time.time() - stime))

这是一个非常优秀的嵌入,也表明只使用一个分类器完美地分开这些类是可能的(详见例子http://scikit-learn.org/stable/auto_examples/plot_digits_classification.html)。t-SNE唯一的不足是它需要更多的时间来计算,因此不适用于大数据集(在目前的条件下)
损失函数的选择
损失函数的选择也非常重要。下面是不同损失函数的说明:
In [29]:
# adapted from http://scikit-learn.org/stable/auto_examples/linear_model/plot_sgd_loss_functions.html
xmin, xmax = -4, 4
xx = np.linspace(xmin, xmax, 100)
plt.plot([xmin, 0, 0, xmax], [1, 1, 0, 0], 'k-',
label="Zero-one loss")
plt.plot(xx, np.where(xx < 1, 1 - xx, 0), 'g-',
label="Hinge loss")
plt.plot(xx, np.log2(1 + np.exp(-xx)), 'r-',
label="Log loss")
plt.plot(xx, np.exp(-xx), 'c-',
label="Exponential loss")
plt.plot(xx, -np.minimum(xx, 0), 'm-',
label="Perceptron loss")
# the balanced relative margin machine
#R = 2
#plt.plot(xx, np.where(xx < 1, 1 - xx, (np.where(xx > R, xx-R,0))), 'b-',
# label="L1 Balanced Relative Margin Loss")
plt.ylim((0, 8))
plt.legend(loc="upper right")
plt.xlabel(r"Decision function $f(x)$")
plt.ylabel("$L(y, f(x))$")
Out[29]:

不同的损失函数有不同的优势:
0-1损失是在分类问题中你实际上需要的。不幸地是,这是非凸优化问题,由于最优化问题会变得或多或少的不好解决,因此并不实用。
合页损失(使用支持向量分类)导出一个在数据中稀疏的解(由于$f(x) > 1$,它变为0),而且对离群点比较稳健(由于$f(x)to-infty$,它仅仅成线性增长)。它不提供充分的校准的概率。
对数损失函数(比如,在逻辑回归中使用)导出很好的概率校准。因此,如果你不仅得到二值预测,还可以得出结果的概率,这个损失函数是一个很好的选择。缺点是,它的解在数据空间中是不稀疏的,它比合页损失函数更容易受到离群点的影响。
指数损失函数(在Adaboost中使用)非常容易受离群点的影响(由于当$f(x)to-infty$时它快速增加)。它主要适用于Adaboost中,因为它在一个简单有效的boosting算法中有效果。
感知器损失函数基本上是合页损失函数的移动版本。合页损失函数也惩罚非常接近边界但是在正确一边的点(间隔最大化准则)。另一方面,感知器损失函数只要数据点在边界正确的一边就可以,如果数据是线性可分就使得边界待定,导致比间隔最大化更差的泛化性。
总结
以上我们讨论了一些怎么让机器学习在一个新的问题上工作起来的建议。我们考虑了分类问题,回归和聚类问题也与之类似。然而,专注于人工数据集(为了便于理解)还有点过于简单化。在很多实际问题中,数据的收集、组织、预处理是极重要的。请参见本文中data wrangling的例子。Pandas是这方面很好的工具。
很多应用领域也有具体要求,也有符合这些要求的工具,比如:
我们不详细探索这些领域;然而,寻找一个好的预处理流程往往比选择一个合适的分类器需要付出更大的努力。我们可以通过一个例子初识一个中等复杂的信号处理流程,该例中使用pySPACE在脑电波数据中检测特定事件相关电位:
https://github.com/pyspace/pyspace/blob/master/docs/examples/specs/node_chains/ref_P300_flow.yaml
信号处理流程包含数据标准化,抽取,带通滤波,降维(xDAWN是一个监督的降维方法),特征提取(局部直线特征),和特征标准化。下图给出了pySPACE中分类之前可用的流程各部分的一个概貌。
In [30]:
Image(filename='algorithm_types_detailed.png', width=800, height=600)
Out[30]:

机器学习的一个长远目标,也是深度学习领域的追求,是可以学习大部分这样的流程,而不是手工编写它们。
In [31]:
%load_ext watermark
%watermark -a "Jan Hendrik Metzen" -d -v -m -p numpy,scikit-learn
Jan Hendrik Metzen 29/01/2015
看完本文有收获?请转发分享给更多人
关注「大数据与机器学习文摘」,成为Top 1%


